Introduction
When troubleshooting a physical network appliance, you can visit the status page to generate a read-only report for your appliance.
Table of contents
- Access the Appliance Status page
- The Appliance Status page
- Refresh intervals
- Metrics Available on the Status Page
Access the Appliance Status page
How do I access the appliance's Status page?
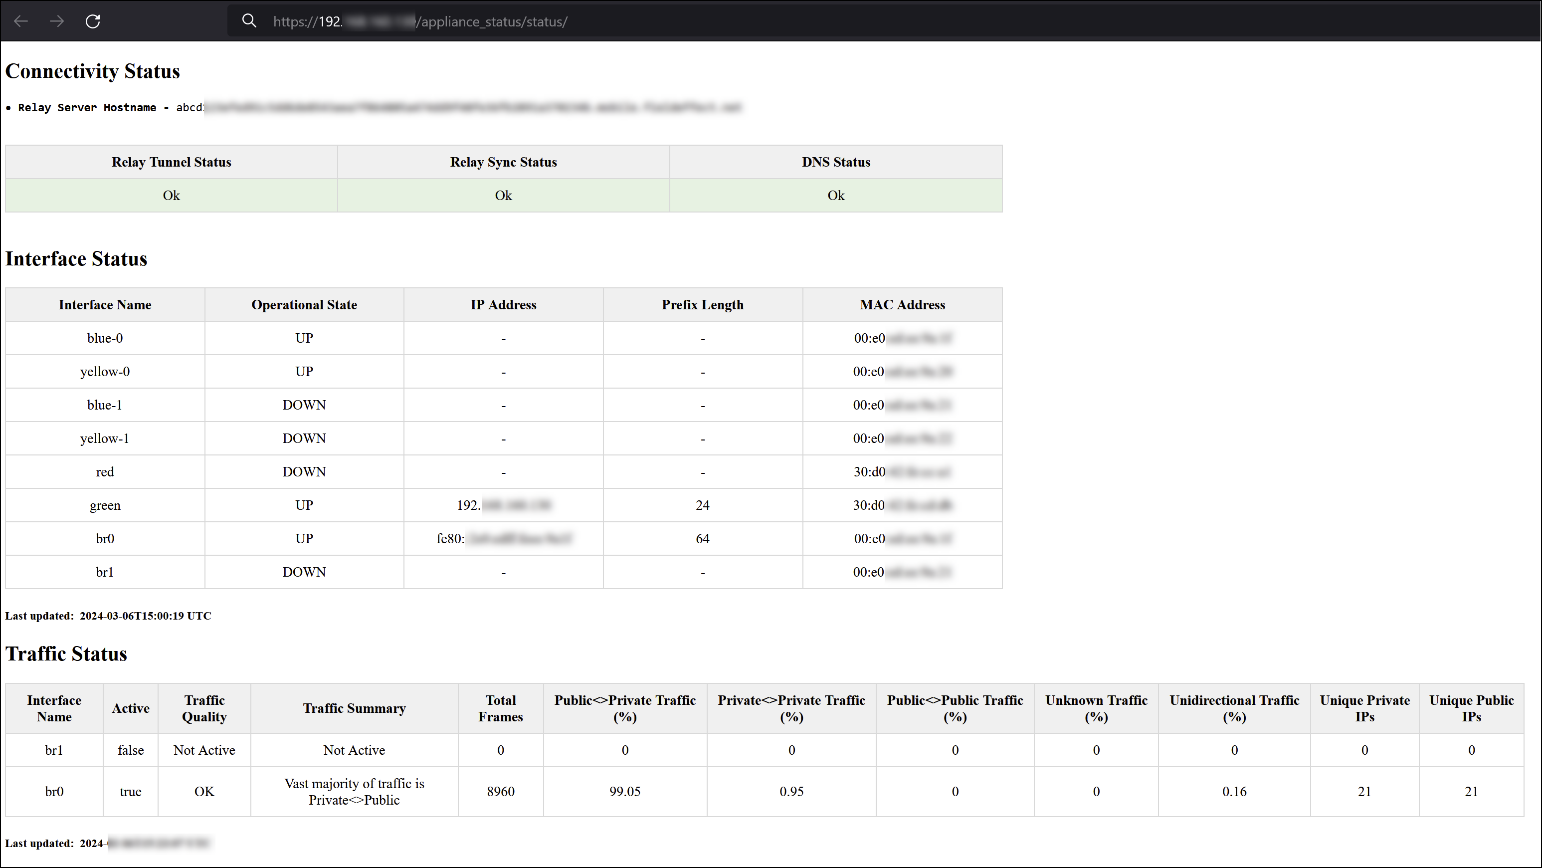
The Appliance Status page

Refresh intervals
The refresh times for this page are as follows:
| Status | Refresh Time |
|---|---|
| Relay Tunnel Status | Every 15 minutes |
| Relay Sync Status | Primary appliances: every 10 seconds Remote Appliances: every 2 minutes |
| DNS Status | Primary appliances: every 10 seconds Remote appliances: every 2 minutes |
| Interface Status | Every 1 hour |
| Traffic Status | Every 1 hour |
Metrics Available on the Status Page
The following metrics are included on the report page:
| Category | Metric | Description |
|---|---|---|
| Connectivity Status | Relay Tunnel Status | Reports on whether the appliance can establish a tunnel to the Relay Server on UDP port 443. |
| Relay Sync Status | Reports on whether the appliance is successfully syncing data to/from the Relay Server. | |
| DNS Status | Reports on whether the appliance is successfully able to communicate with the configured DNS server and resolve the Relay Server Hostname. | |
| Interface Status | Interface Name | The name of the interface being referenced. Each interface represents a port on the appliance. To learn more about cabling your appliance and the ports, see the configuration guide for your appliance. |
| Operational State | Whether or not the interface is physically connected and operating as intended. This metric can be set to “UP” or “DOWN”. | |
| IP Address | The IP address assigned to the interface. | |
| Prefix Length | The prefix length for the interface’s configured subnet mask. | |
| MAC Address | The MAC address of the interface. | |
| Traffic Status | Interface Name | The name of the interface being referenced. Each interface represents a port or combination of ports on the appliance. To learn more about cabling your appliance and the ports, see the configuration guide for your appliance. |
| Active | Reports on whether the interface is receiving traffic. This can be set to “TRUE” or “FALSE” depending on whether the appliance is detecting incoming traffic for that interface. | |
| Traffic Quality | The appliance will take a small snapshot of the incoming traffic being sent to that interface and determine whether it's appropriate for proper analysis of your environment. This can be set to "OK", "Could be OK", or "Bad". We want visibility on the individual hosts in your network connecting externally. This determination is based on: - The percentage of Public<>Private IP connections, - Seeing both responses and requests (not unidirectional traffic), - Seeing a sufficient number of individual hosts (Private IPs) in the traffic sample. | |
| Traffic Summary | A summary of how the Traffic Quality was determined. | |
| Total Frames | The total amount of packets analyzed in the traffic snapshot. | |
| Public<>Private Traffic (%) | The percentage of traffic in the snapshot that came from Private IPs (potential hosts in your network) communicating with Public IPs (potentially external to your network). | |
| Unknown Traffic (%) | The percentage of traffic in the snapshot that did not match the profile for any of the other categories. | |
| Unidirectional Traffic (%) | The percentage of traffic in the snapshot that was unidirectional or one-sided. | |
| Unique Private IPs | How many unique Private IPs (potential hosts in your network) that were detected in the snapshot. | |
| Unique Public IPs | How many unique Public IPs (potentially external to your network) that were detected in the snapshot. |
Was this article helpful?
That’s Great!
Thank you for your feedback
Sorry! We couldn't be helpful
Thank you for your feedback
Feedback sent
We appreciate your effort and will try to fix the article