Introduction
Field Effect Risk Score Reports are sent to you monthly through the MDR Portal, and report on three risk factors: Software, Operating System, and Configuration risk. Each factor has numerous underlying analytics and associated data points (sub-factors) that contribute to them.
These three risk factor scores then determine your organization's overall Device Risk score.
Let's take a look at each factor:
Device Risk is the average measure of risk found across all of your Field Effect-monitored devices using a simple scale of 0 to 100. Scores above 90 represent the presence of Critical Risk. Some devices will have higher and lower individual scores than your average, and you can learn more about them and where risk is present within the report. Device risk is measured using an evolving set of analytics that identify Software, Operating System and Configuration Risks.
- Software Risk is a measure of a device’s currently installed software. It is informed by sub-factors like CVE publications, whether software is running, software behavior/permission patterns, whether software is expected, the device’s location in the environment, and more.
- Operating System Risk is a measure of a device’s operating system and closely related to both Software and Activity Risk - sharing many of the same informing sub-factors. This focuses on OS-specific security controls.
- Configuration Risk is a measure of activity taking place on a device. It is informed by sub-factors like the use of embedded features and applications, recently installed or uninstalled software, activated or deactivated features/utilities, the type of networks the device connects to (particularly public ones), and more.
Accessing Field Effect Risk Score Reports
For Partners: when the organization selector is set to the partner view, all client reports are available in the sidebar's primary Reports view.
When a Risk Report is published, it will be available to view or download from the Reports view, accessible in the sidebar's Insights section.
You can view reports directly from here or download them to share externally.
Reading Your First Field Effect Risk Score Report
If you are new to the Field Effect Risk Score Report, the flowing details all the sections included in the monthly report.
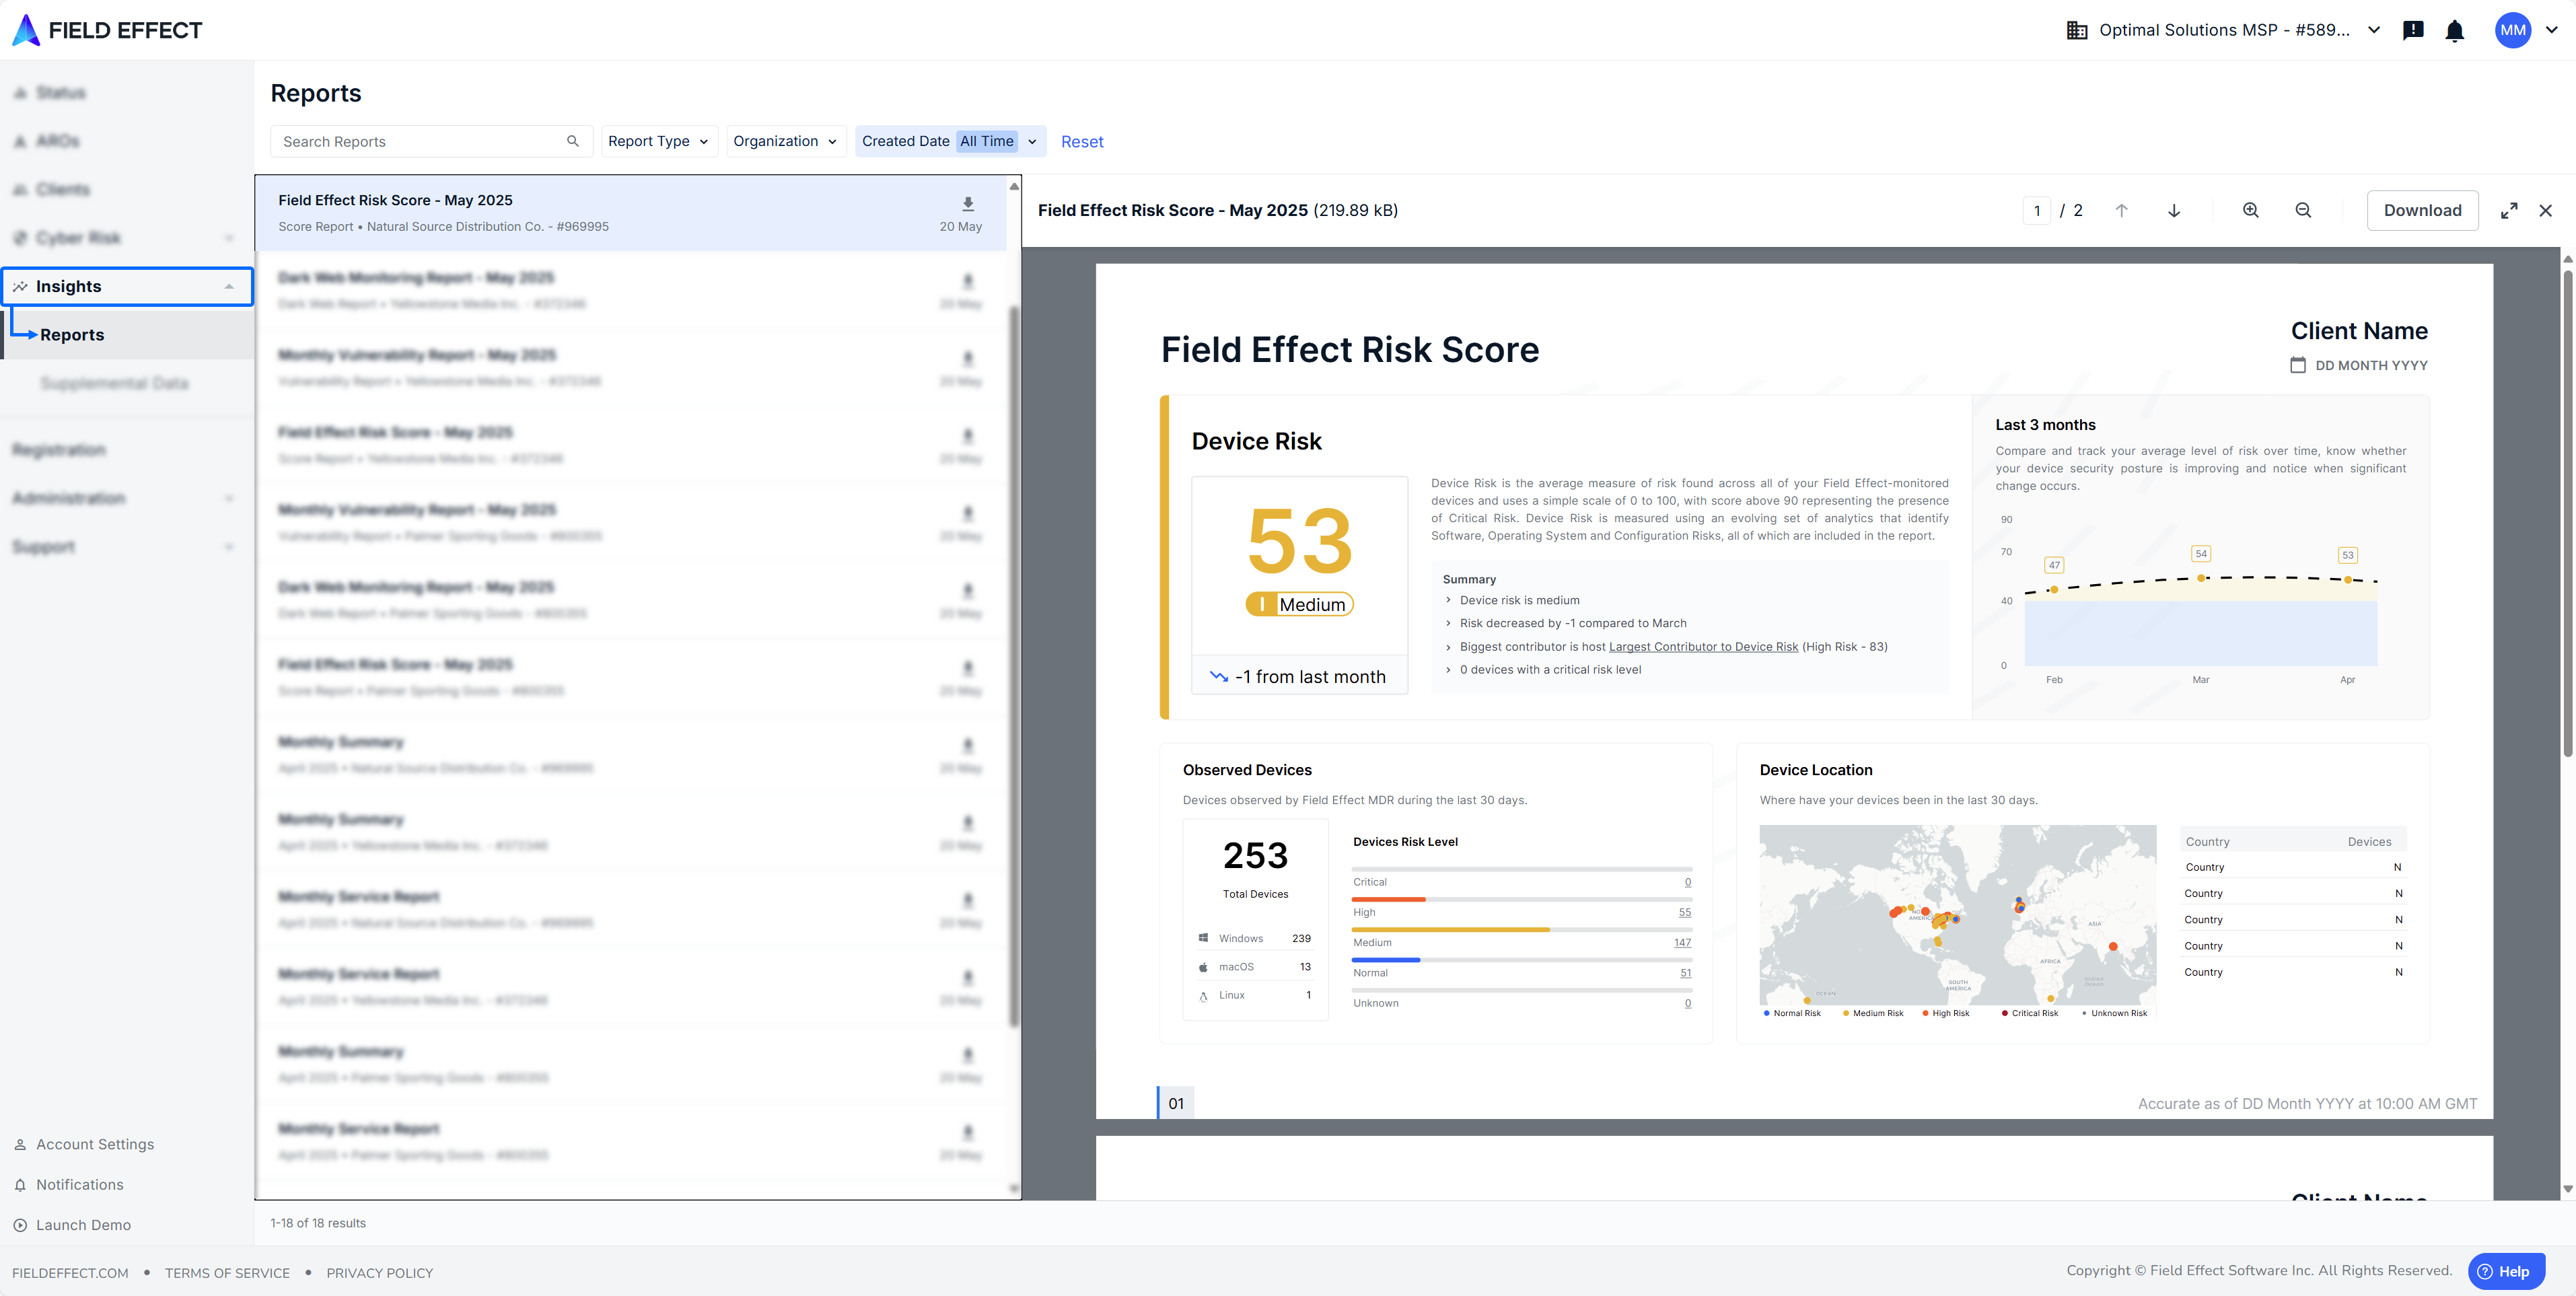
Page 1 - Your Overall Device Risk Score
The first page is made up of four sections that present your organization's overall Device Risk score. Along with the score itself, you can use this page to track changes in your overall device risk score over time and be alerted on areas of concern across your organization's devices.

1 - Device Risk
Device Risk is the average measure of risk found across all of your Field Effect-monitored devices and uses a simple scale of 0 to 100, with scores above 90 representing the presence of Critical Risk. Device risk is measured using an evolving set of analytics that identify Software, Operating System and Configuration Risks. Some devices will have higher and lower individual scores than your average.
In the example below, the organization's device risk score is 47, which is considered a medium level score. It has also risen during the course of the month by 8 points.
This section will contain content that is unique to your device risk score's monthly standing, along with a bullet point summary of the report's findings.

2 - Last 3 Months
This section helps you track any changes in your device risk score over a 3-month period. From here, you can compare and track your average level of risk over time, know whether your device security posture is improving, and notice when significant change occurs.
In the example below, the organization was on track with a downward trend in their device risk, but this month it has risen to 47, the highest risk level for the organization in the last three months.
This section will also contain content that is unique to your risk trends and changes in device risk score.

3 - Observed Devices
This section lists the devices observed by Field Effect MDR during the last 30 days and groups them by their level of device risk. A tally of total devices There is also a tally of total devices and device counts per operating system.
In the example below, the organization has 57 devices in the high-risk group and 63 with a 178 in medium group.
This section will also contain content that is unique to your devices and risk levels for the month.

4 - Device Location
This section maps all devices observed by Field Effect MDR during the last 30 days and uses color (see the map legend) to communicate levels of risk geographically. The top 5 countries by user count are also included alongside the map.
In the example below, the organization's users are concentrated in North America, with Canada being the most populated, but they also have a global presence. Most of their high-risk users are concentrated in North America as well.
This section will also contain content that is unique to your users and their locations over the course of the month.

Page 2 - Your Risk Score's Contributing Factors
The second page of the report drills into each factor that contributed to your overall device risk. the primary factors include software, operating system and configuration risk.
The following sections summarize and highlight your most important risks and where to find them.

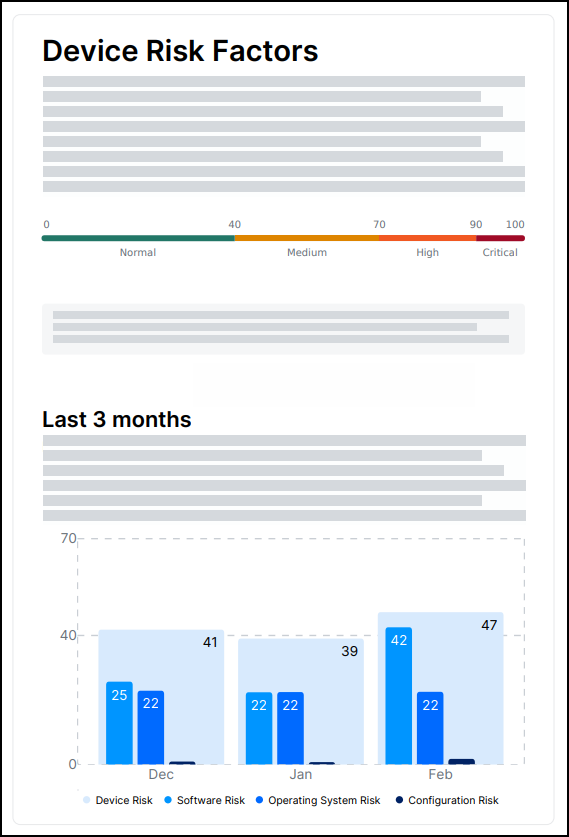
1 - Device Risk Factors
Each contributing factor is measured and tracked through a suite of analytics and presented using the simple scale below.
The Last 3 months graph provides a look at how your Software, Operating System, and Configuration risk levels have changed over the last 3 months, alongside your overall Device Risk Scores. Use this to track and prioritize your security efforts and to help ensure related AROs are actioned.
In the example below, the organization had a Software risk score of 25, which contributed to their overall device risk score of 41 for December. For January, their Software risk has risen to 42, contributing to their overall Device risk score of 47 for January.
This section will contain content that is unique to your device risk factors and monthly changes.
2 - Software Risk
This section measures the level of risk presented by software currently residing on devices in your environment. Software risk is informed by sub-factors such as CVE publications, whether software is running, software behavior/permission patterns, whether a piece of software is expected, the device’s location in the environment, and many more.
In the example below, the organizations Software risk level rose 21 points to 43 for the month. An Openssh-Client vulnerability was detected on 32 devices during the month, with a CVSS ranking of 9.8.
This section will contain content that is unique to your software risk. Clicking See all devices with vulnerable software will take you to a filtered view of the Endpoint Devices page.

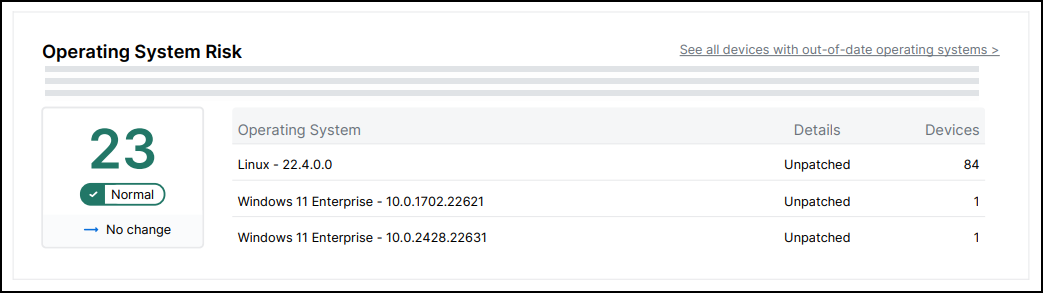
3 - Operating System Risk
This section measures the level of risk presented by device operating systems installed in your environment. This risk score is closely related to both Software and Activity risk, sharing many of the same informing sub-factors, along with others such as the state of certain OS-specific security controls.
In the example below, the organization's Operating System risk score has not changed since the preceding month. Field Effect also detected 84 devices running an unpatched version of Linux.
This section will contain content that is unique to your operating system risk. Clicking See all devices with out-of-date operating systems will take you to a filtered view of the Endpoint Devices page.
4 - Configuration Risk
This section measures the level of risk presented by activity taking place on, or by, devices in your environment. Contributing factors for this score include the use of embedded features and applications like PowerShell, recently installed/uninstalled or activated/deactivated features and utilities (especially related to device performance and security), the type of networks the device connects to (particularly public ones), and many more.
In the example below, the organization's Configuration risk score has not changed since the preceding month. Field Effect also detected 13 out of date Microsoft Defender signatures and 19 devices that have not been scanned recently.
This section will contain content that is unique to your configuration risk. Clicking See all devices with configuration issues will take you to a filtered view of the Endpoint Devices page.

Was this article helpful?
That’s Great!
Thank you for your feedback
Sorry! We couldn't be helpful
Thank you for your feedback
Feedback sent
We appreciate your effort and will try to fix the article