Introduction
This page is only available for Field Effect Partners.
The Clients view is a page available for that partners that acts as a centralized table where you can view and manage all of the client organizations you manage a Field Effect deployment for.
From this table, you can gain insights about you client organizations that include:
- Which clients have services online or offline?
- Which clients fall into Core or Complete service tiers?
- Which clients have features enabled or disabled (Cloud Monitoring, DNS Monitoring, Endpoint Monitoring)?
- Which clients have an active or inactive status?
- The types of AROs (Action, Recommendation, Observation) they have received, and how many times they requested help?
- How many SEAS submissions has a client created?
This article introduces the view, describes the available columns and to sort or filter them.
Accessing the Clients View
This view is accessible from the sidebar, but you must be using MDR Portal's partner view to access it. If the organization selector is set to a specific client view, the Clients view will not be visible. To learn more, visit Using the Organization Selector.

Using the Clients View
The Clients view itself is presented as a table and lists each client you manage.

The Clients view includes the following columns:
| Column | Visible by Default? | Notes |
|---|---|---|
| Name | Yes | The name of the client organization. Clicking on the client’s name will take you to their client view in the MDR Portal. To learn more about the views available to partners, see The Organization Selector. |
| Integrations | Yes | Displays, via icon, each cloud service the client has enabled for Field Effect cloud monitoring. |
| Parent | Yes | In some scenarios, a client may be managed by multiple partner organizations. This allows partners to filter the results based on clients they co-manage with other MSPs. |
| Cloud Accounts | Yes | The number of cloud accounts associated to the cloud service with the most accounts. If a client’s Google Workspace instance has the highest number of accounts, it will display the total accounts for Google Workspace. If a client has more accounts in Microsoft 365 (M365), this column will display the number of M365 users. |
| DNS Firewall | Yes | This column informs, via a checkmark icon, whether the client has enabled the DNS Firewall. |
| Appliances | Yes | The number of physical network appliances the client has deployed. |
| Agents | Yes | The total number of endpoint agents (online or offline) currently in the system for each client. |
| Active Response | Yes | The response policy (Off, Limited, Balanced, Aggressive) that the client currently has in place. |
| SEAS Submissions | Yes | The number of Suspicious Email Analysis Service (SEAS) submissions made by each client. |
| As (Actions) | Yes | The number of Action AROs that were generated during the selected period. |
| Rs (Recommendations) | Yes | The number of Recommendation AROs that were generated during the selected period. |
| Os (Observations) | Yes | The number of Observation AROs that were generated during the selected period. |
| Status | No | The status of the client (Active/Inactive) |
| Service Tier | No | The service tier a client falls into: Core or Complete |
| Client ID | No | The unique tracker ID for a client |
Drilling into a Client
When selecting a client in the table, the details pane will appear on the right side of the screen. If you would rather focus on the columns, this details pane can be closed.
Clicking on the name of the client will set the organization selector to that specific client view and the client's Dashboard page.

Searching and Filtering the Clients View
Searching the Clients View
If you manage many clients, you can use the search bar at the top of the view to search for a specific client by keyword. In the example below, the partner used the search bar to filter “Baltic,” and the results show all clients with “Baltic” in their client name. As you type in a query, the chart will automatically update.

Filtering the Clients View
This page allows you to filter the results against the following parameters:
- Status: whether or not the client is an active Field Effect MDR client.
- Example: setting the status to Active (default), will only show active clients in the table's results.
- Parent: filter clients by which partner organization they are a managed by.
- Example: In some scenarios, a client may be managed by multiple partner organizations. This allows partners to filter the results based on clients they co-manage with other MSPs.
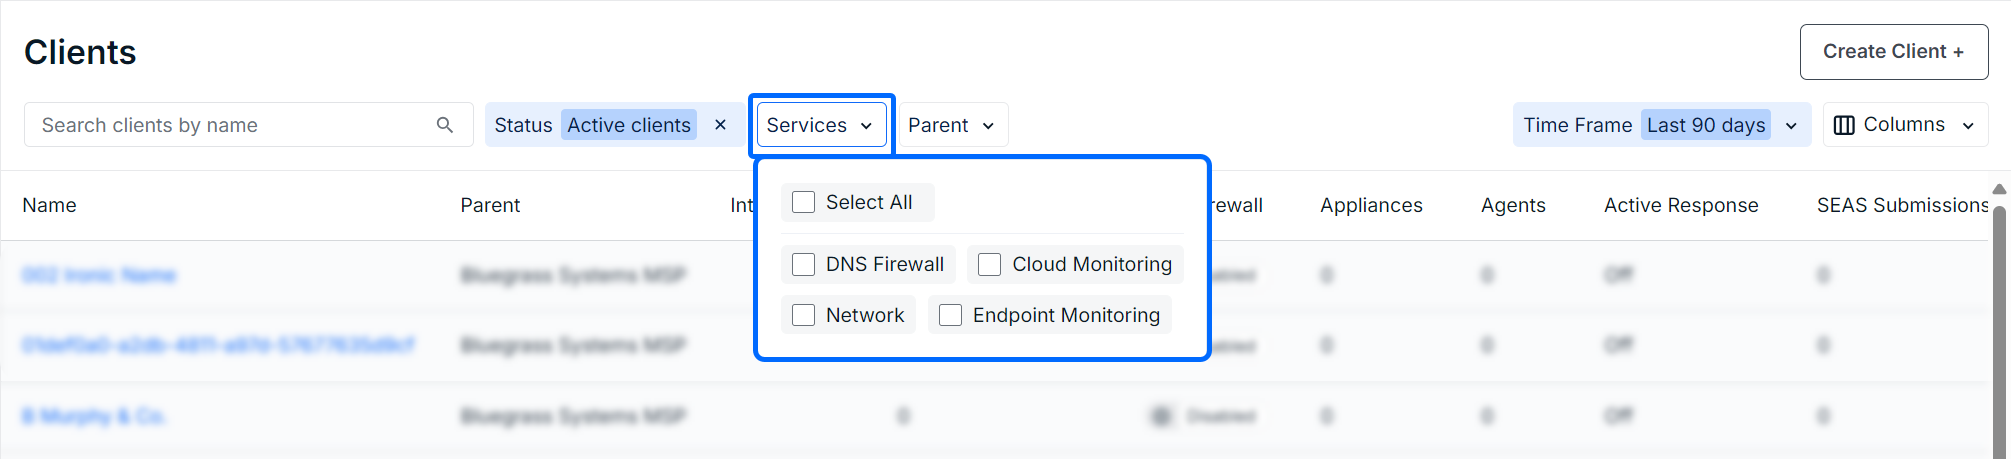
- Services: filter clients by the services they have enabled.
- Example: selecting DNS Firewall will filter the results to show only clients with the DNS firewall enabled.
- Service Tier: filter clients by the service tier they belong to.
- Example: setting the service tier to Complete will filter the results to only show clients in the Complete service tier.
These filters are accessible beside the search bar and use dropdown menus for filter selection. In the example below, the user has the Services filter opened.
Setting a Time Period for the View
The time filter does not apply to the following columns: cloud mail accounts, agents, integrations, DNS firewall, appliances, agents, and Active Response.
If you want to see metrics for a specified period of time, use the time dropdown menu on the upper right of the table and select your time period. The table chart will be updated to show only metrics from the selected period (30, 90, or 365 days).
Adjusting the Client View’s Columns
You can choose to sort by column or remove columns from the view.
Adding and Removing Columns
To customize the columns shown in the Clients view, click the Columns dropdown menu. Every checked column will be visible in the table, and unchecked columns will be removed from the table. To confirm you selections, click Apply in the dropdown.
Sorting the view by Columns
Clicking on a column header will toggle between sorting the table in an ascending or descending order, based on the column that was clicked for sorting. When the up-arrow icon is boldened, the column is being sorted in an ascending order. When the down-arrow icon is boldened, the column is sorted in a descending order.
In the example below, the partner has the view sorted by client name, and in an ascending order.

Was this article helpful?
That’s Great!
Thank you for your feedback
Sorry! We couldn't be helpful
Thank you for your feedback
Feedback sent
We appreciate your effort and will try to fix the article