Introduction
For Partners: the Insights section is only visible when the Organization Selector is set to a specific client view.
The MDR Portal's Insights section helps you understand your organization's security posture by highlighting trends, risks, and activity detected across your environment. It transforms security data into actionable information, making it easier to identify potential issues, monitor changes over time, and prioritize security improvements.
Whether you're reviewing executive-level security trends or investigating specific areas of concern, these Insights provide a centralized view of the information you need to make informed decisions.
Best Practices
To get the most value from Insights:
- Review insights regularly to identify changes in your environment.
- Compare trends over time rather than focusing on a single data point.
- Investigate significant increases in risk or suspicious activity.
- Use insights to guide remediation and security improvement efforts.
- Share relevant information with stakeholders responsible for security decision-making.
Pages Included in the Insights Section
The pages available in this section may vary depending on your organization's MDR service tier, deployment progress, and complexity.
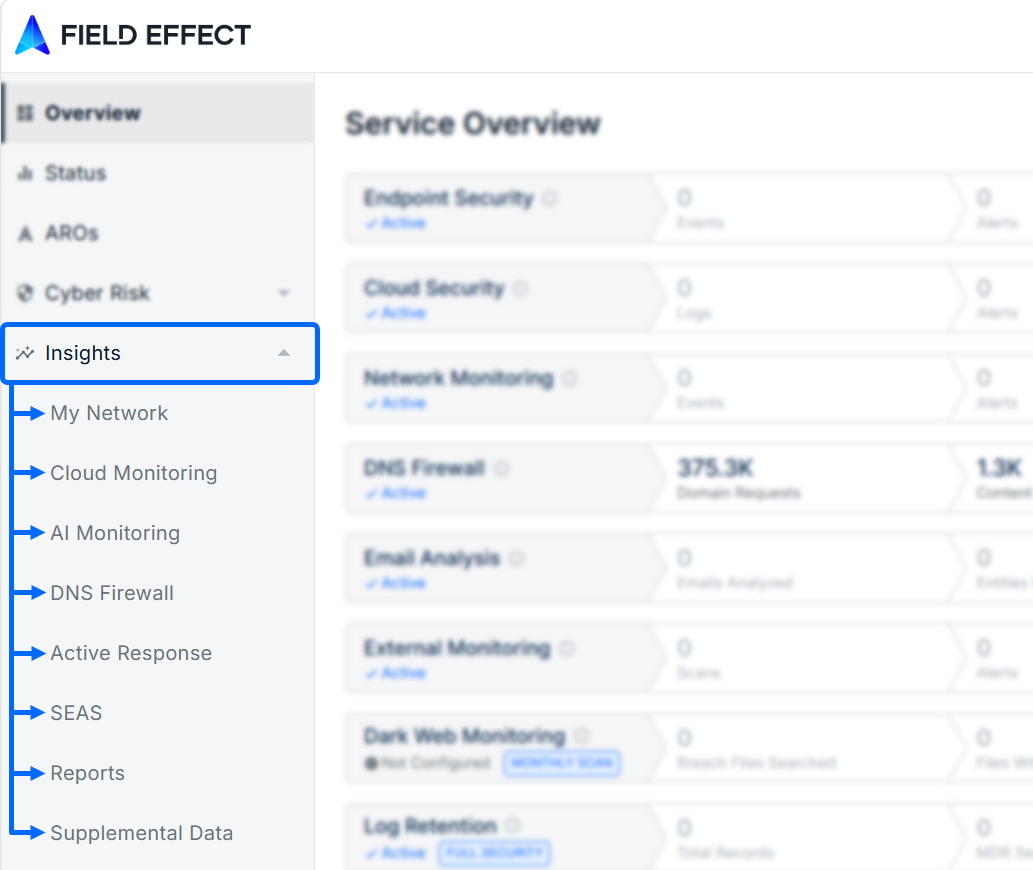
All sections stored in the Insights section include: My Network, Cloud Monitoring, AI Monitoring, DNS Firewall, SEAS, Reports, and Supplemental Data.
My Network
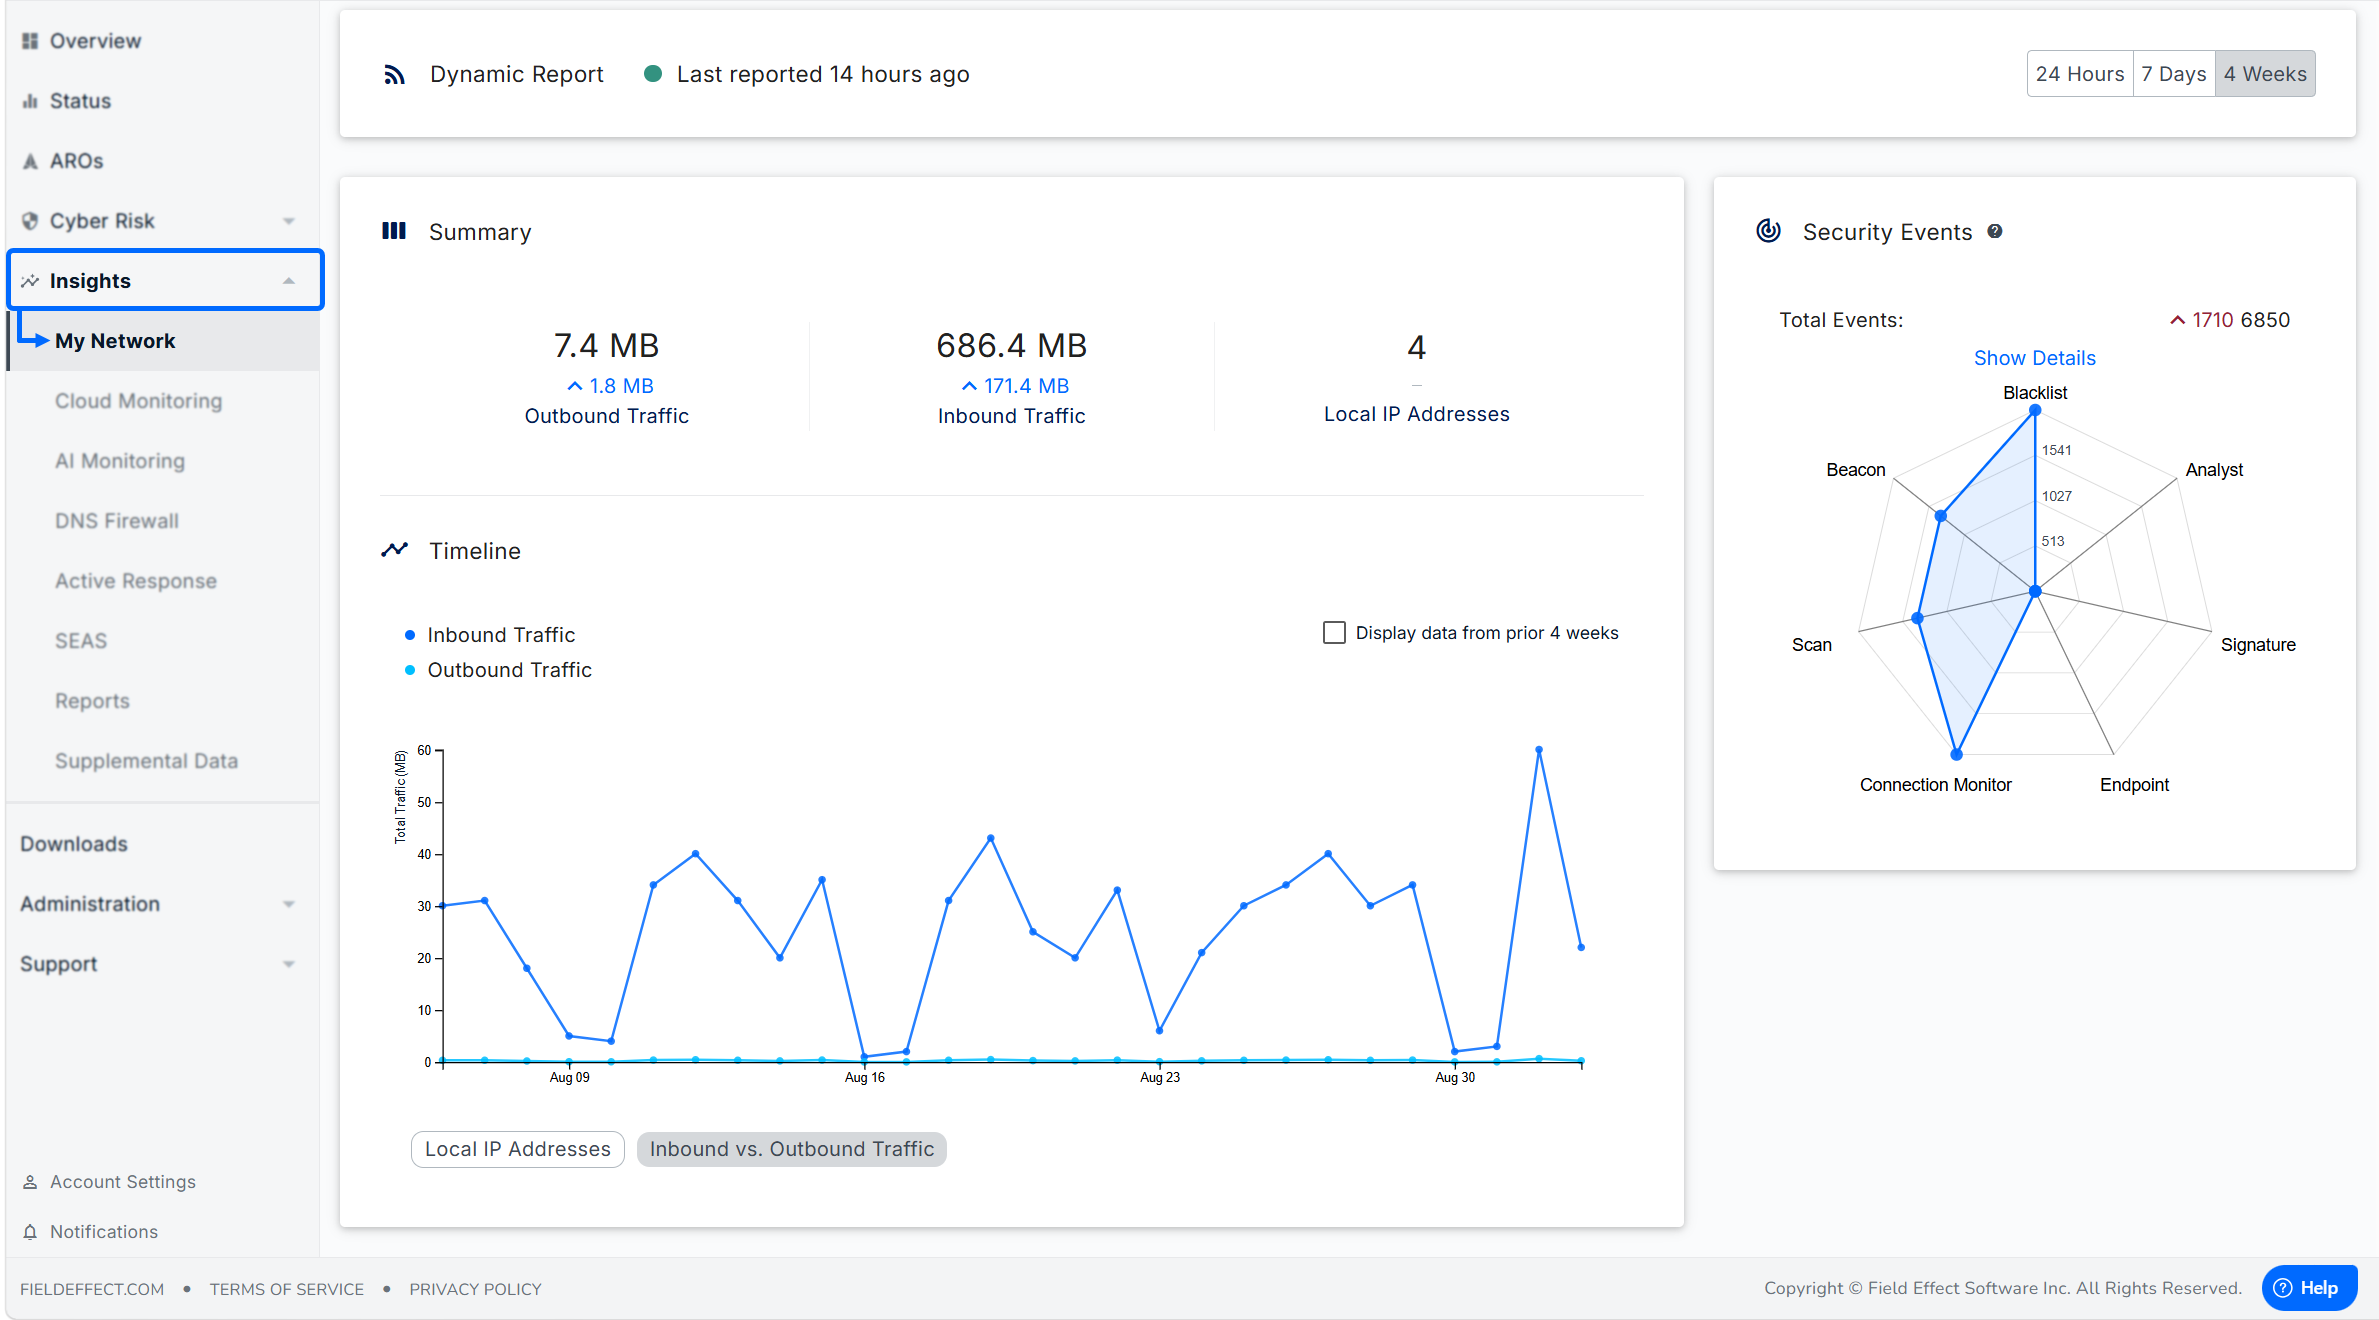
Use this page to summarize network traffic and security events. The page can be set to a 24-hour, 7 day, or 4 week timeframe, and the summary graph can switch between a Local IP Address and Inbound vs. Outbound Traffic view.
Related Articles:
Cloud Monitoring
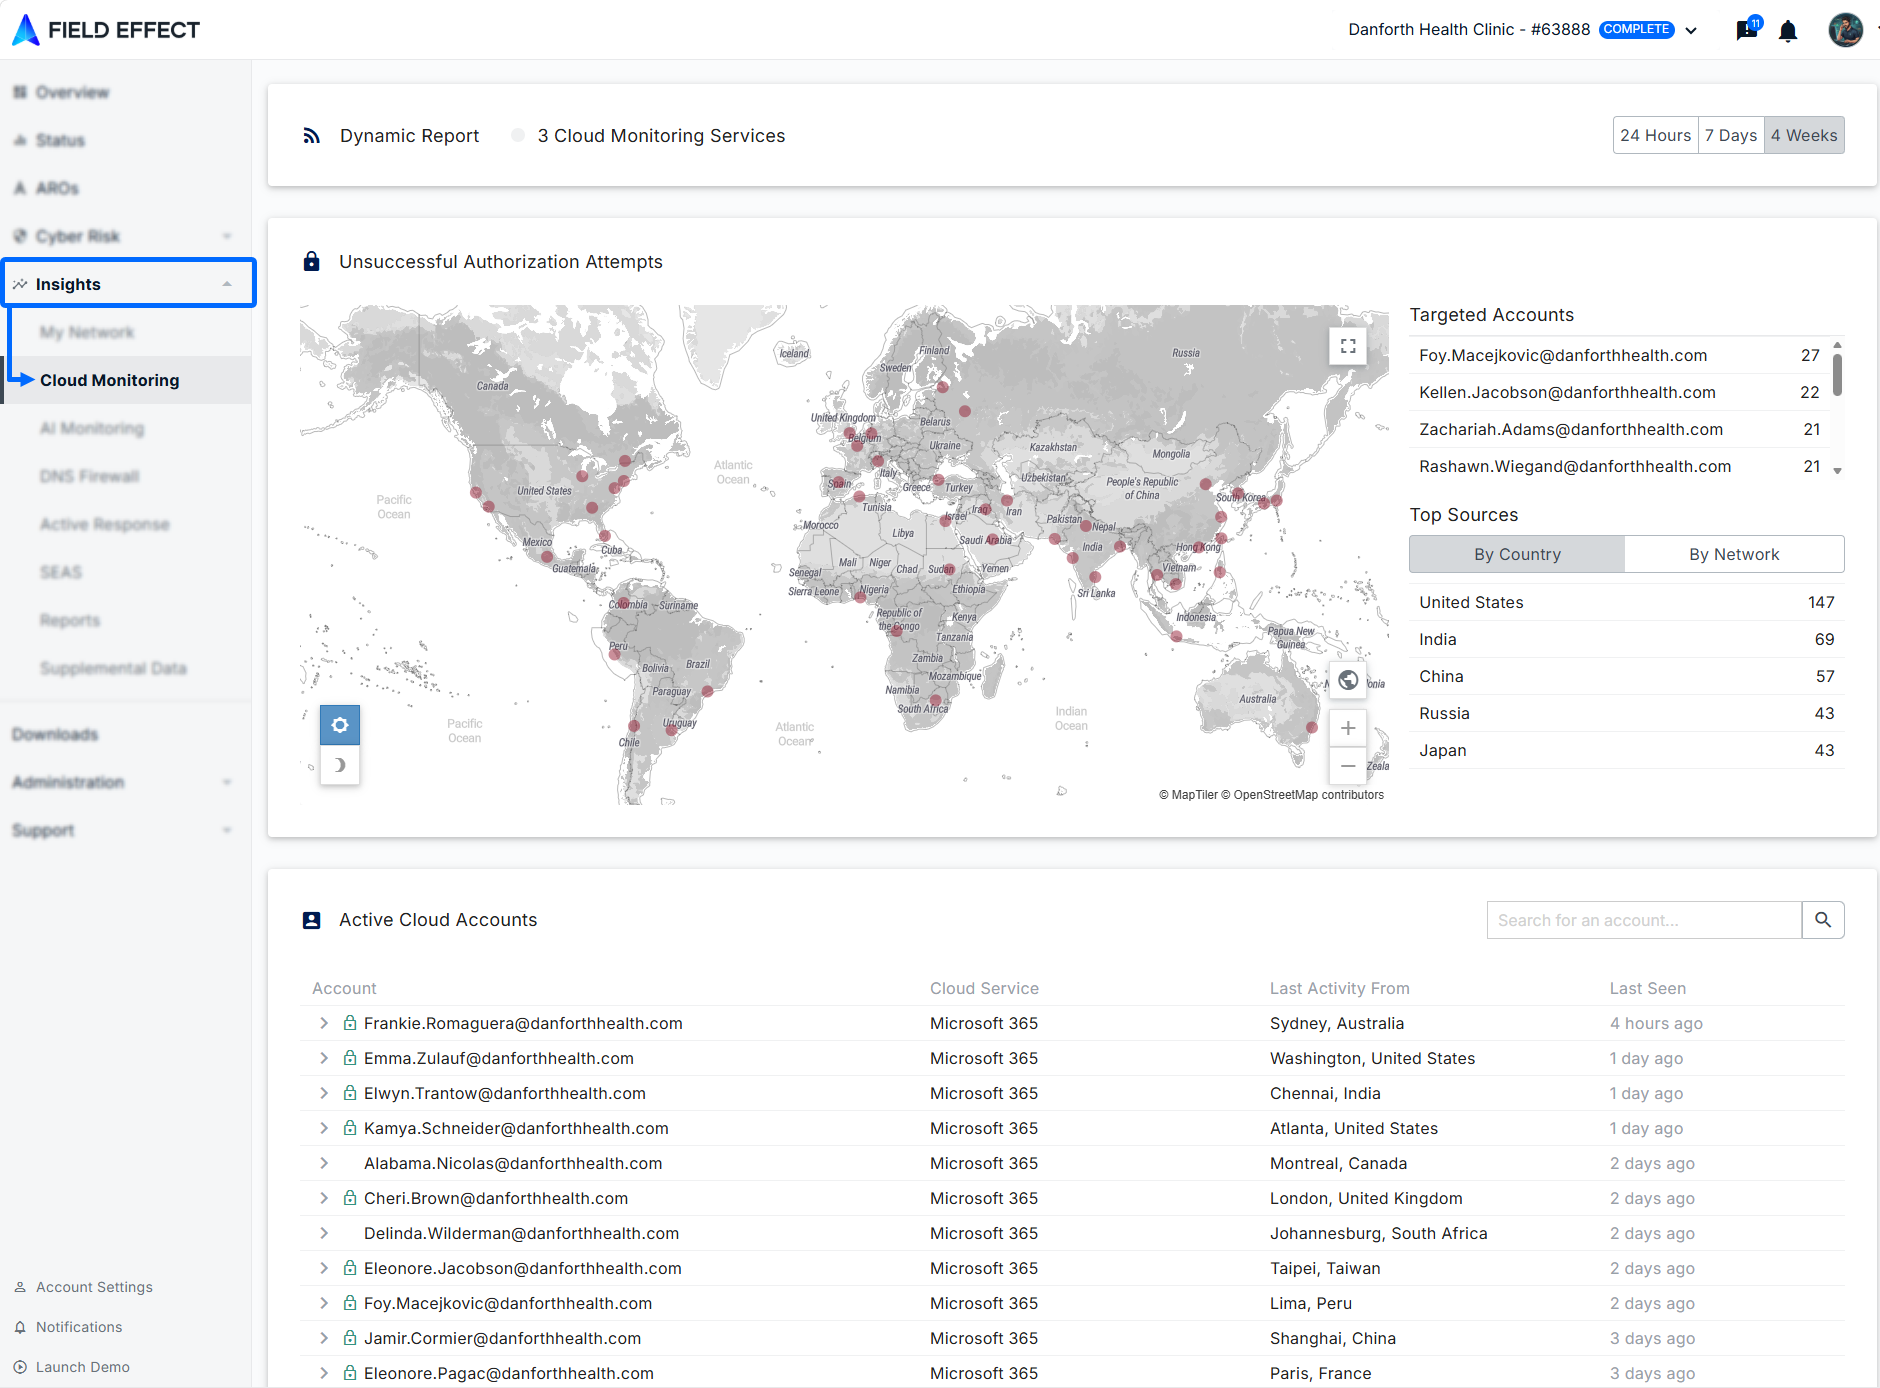
Use this view to monitor login activity (time and location) for connected cloud accounts. View most targeted accounts, and the top threat sources by region.
Related Articles:
AI Monitoring
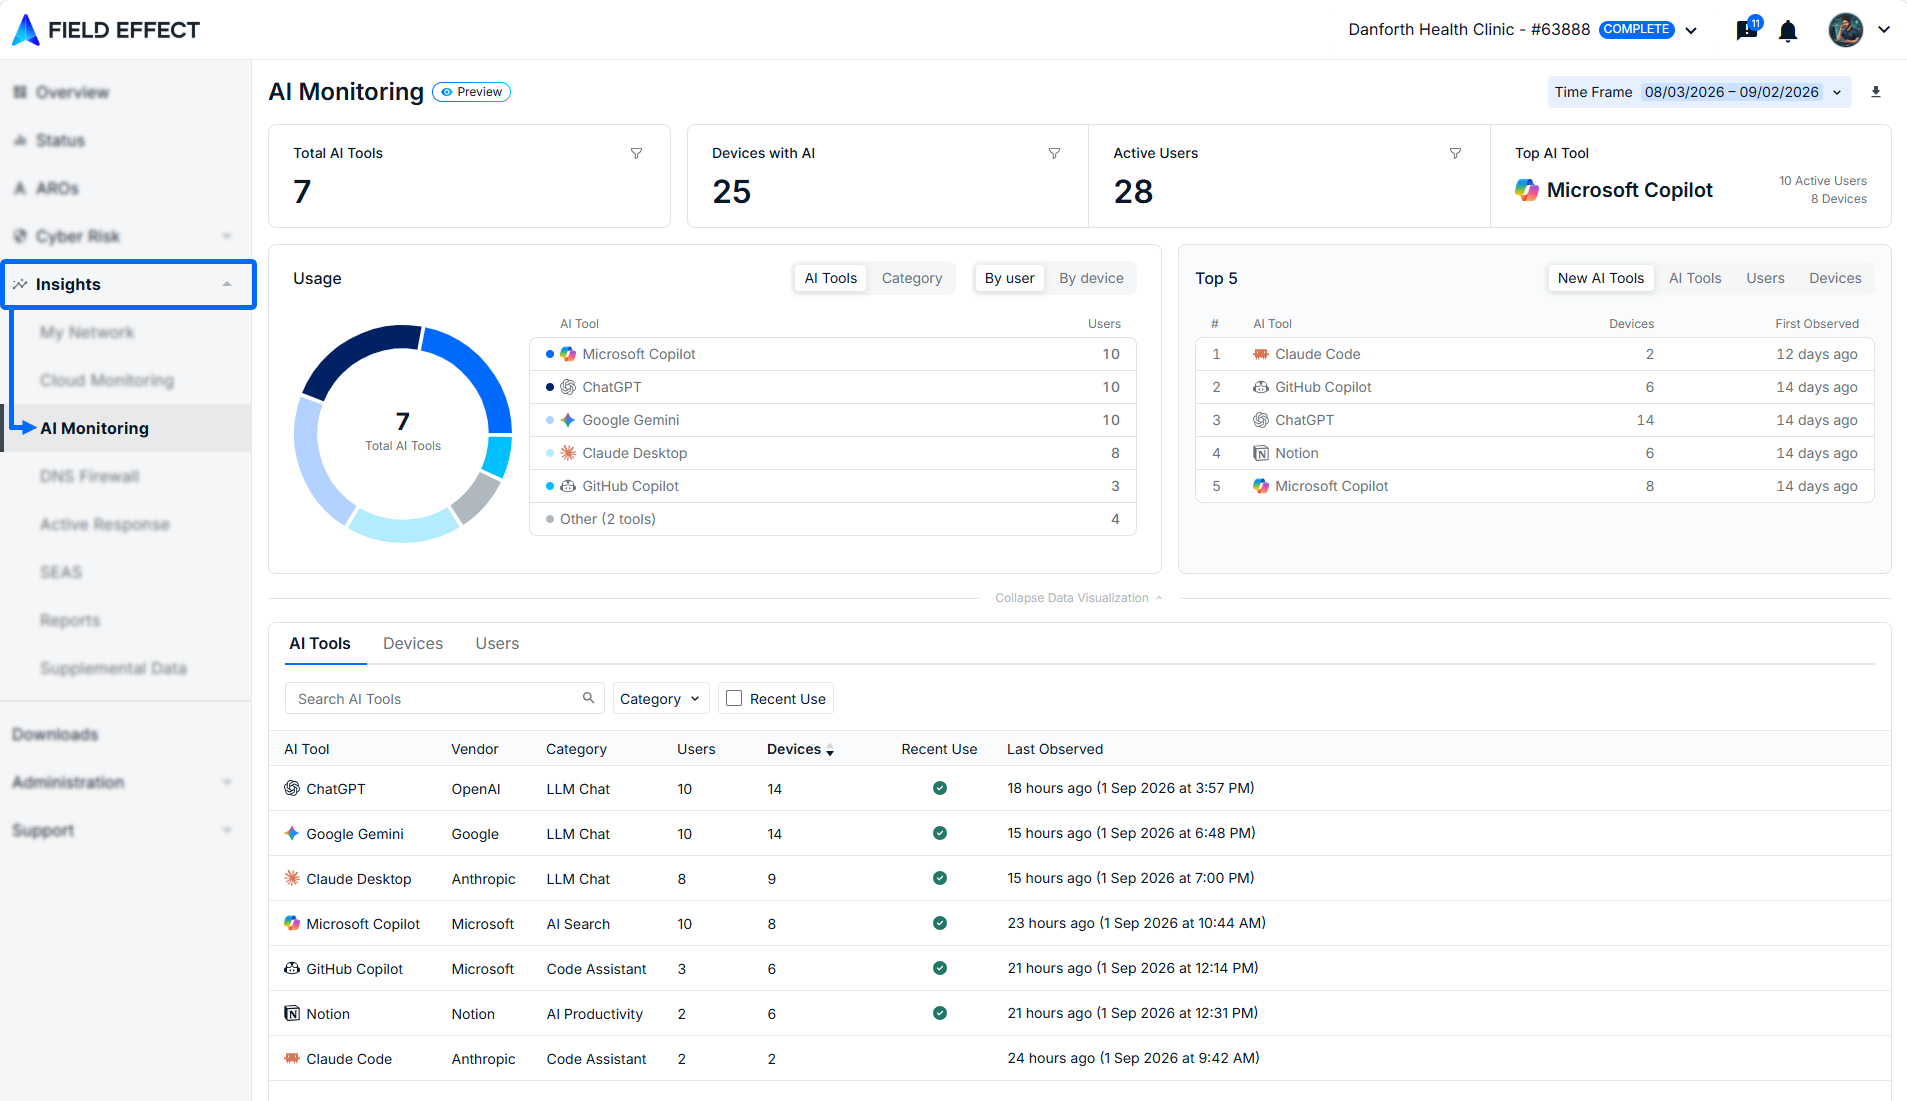
As AI usage becomes more common and widespread, organizations currently have no visibility into what AI tools are installed on endpoint devices, or what AI SaaS applications are being used by employees. This page AI Monitoring page begins to answer this question by surfacing AI tool presence and usage patterns.
Related Articles:
DNS Firewall
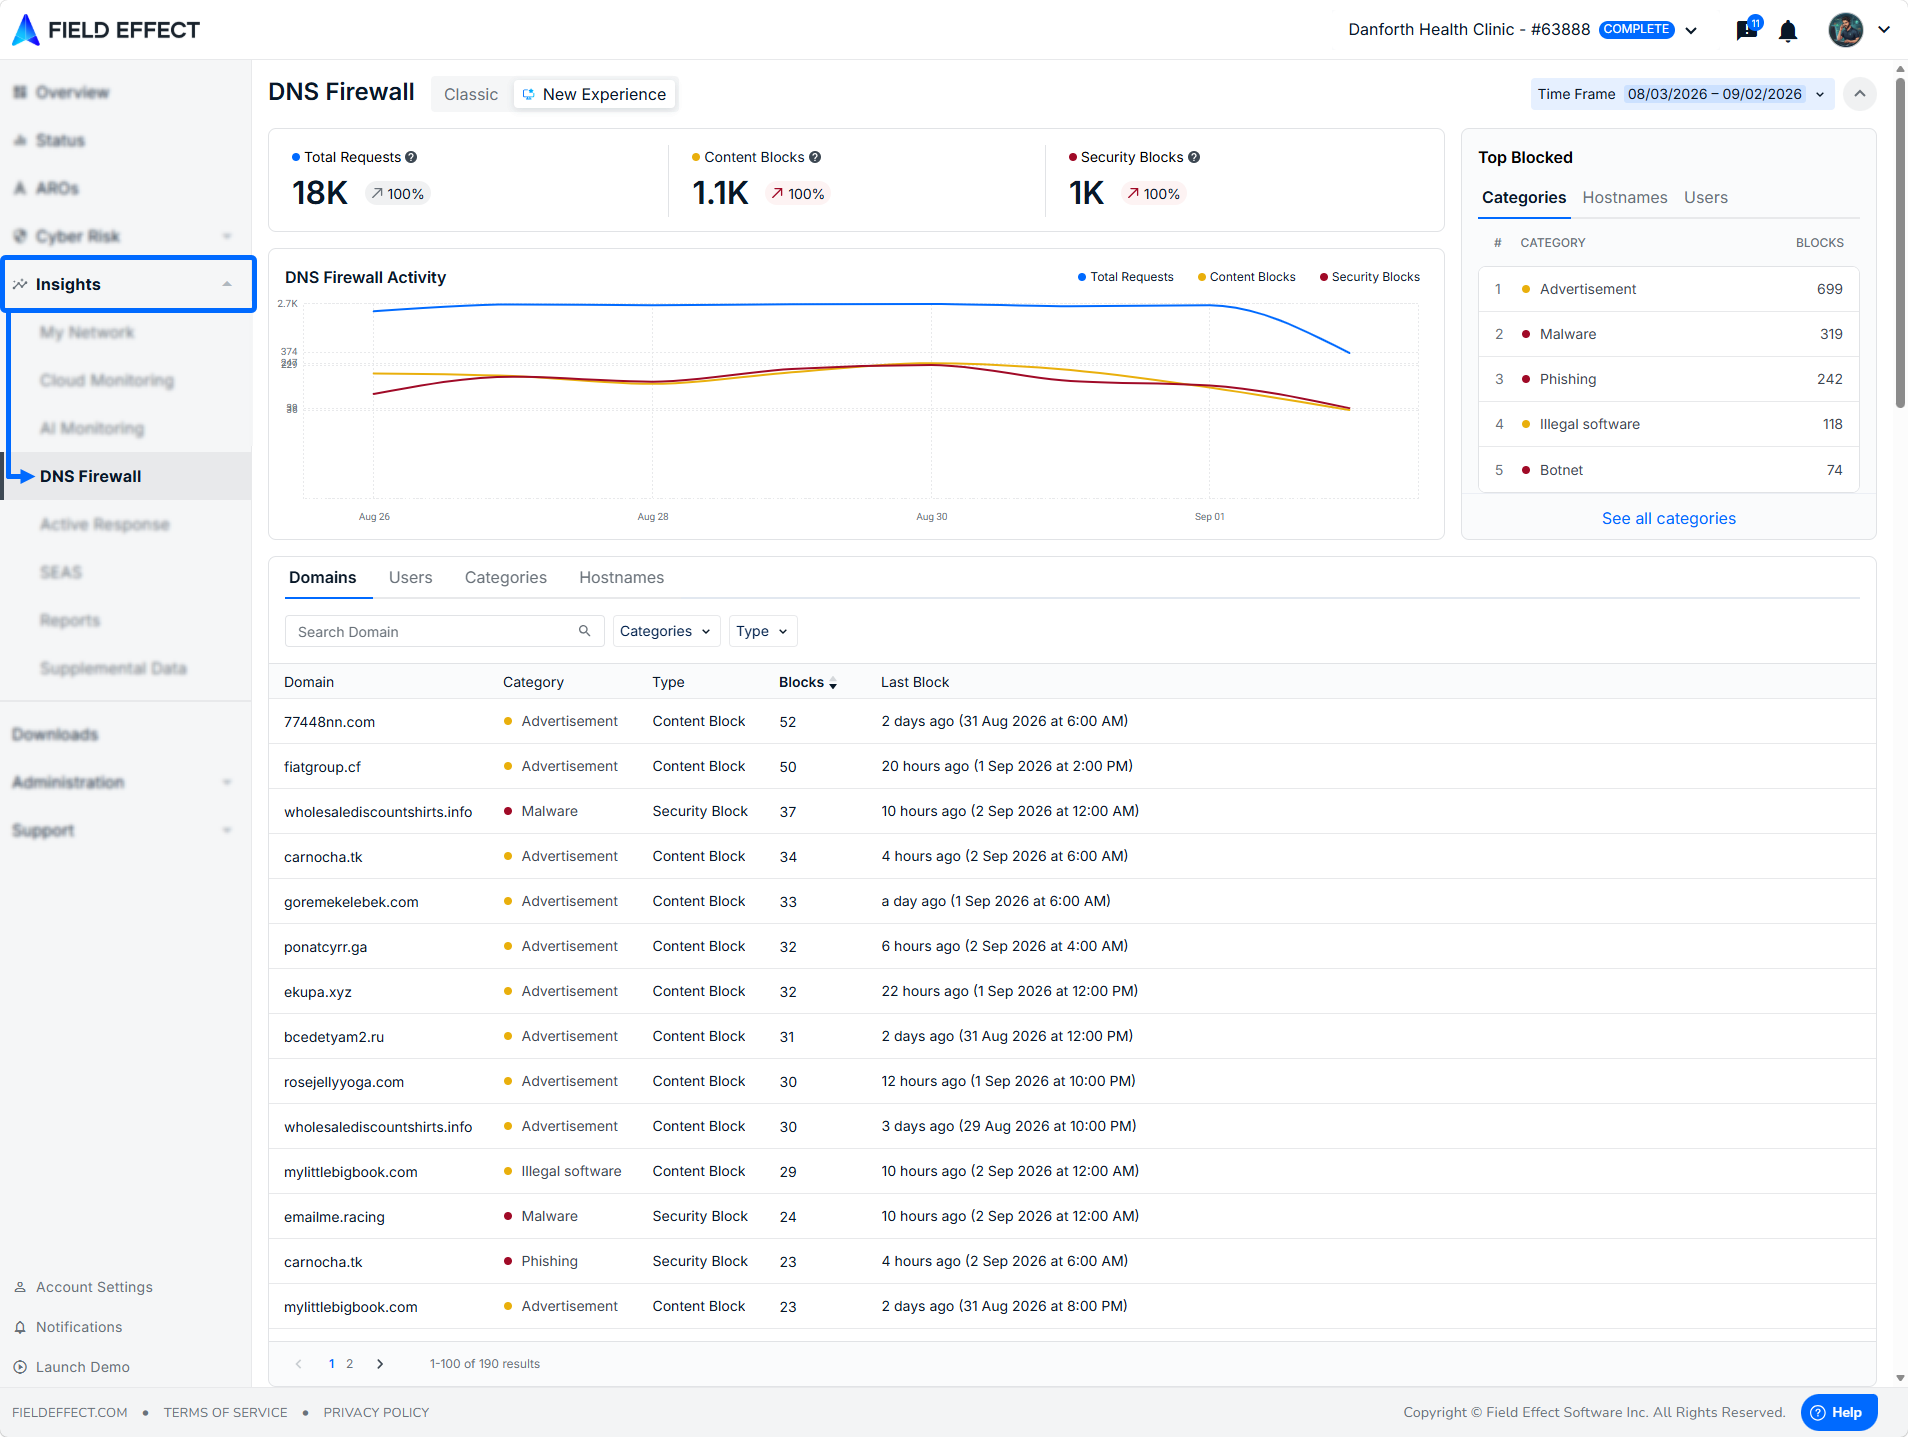
This dashboard provides detailed information about the users, their domain requests, and any resulting blocks to occur, present on your organization's network. View summarizes of all requests and blocks performed by the DNS Firewall (based on content and security).
Related Articles
Active Response
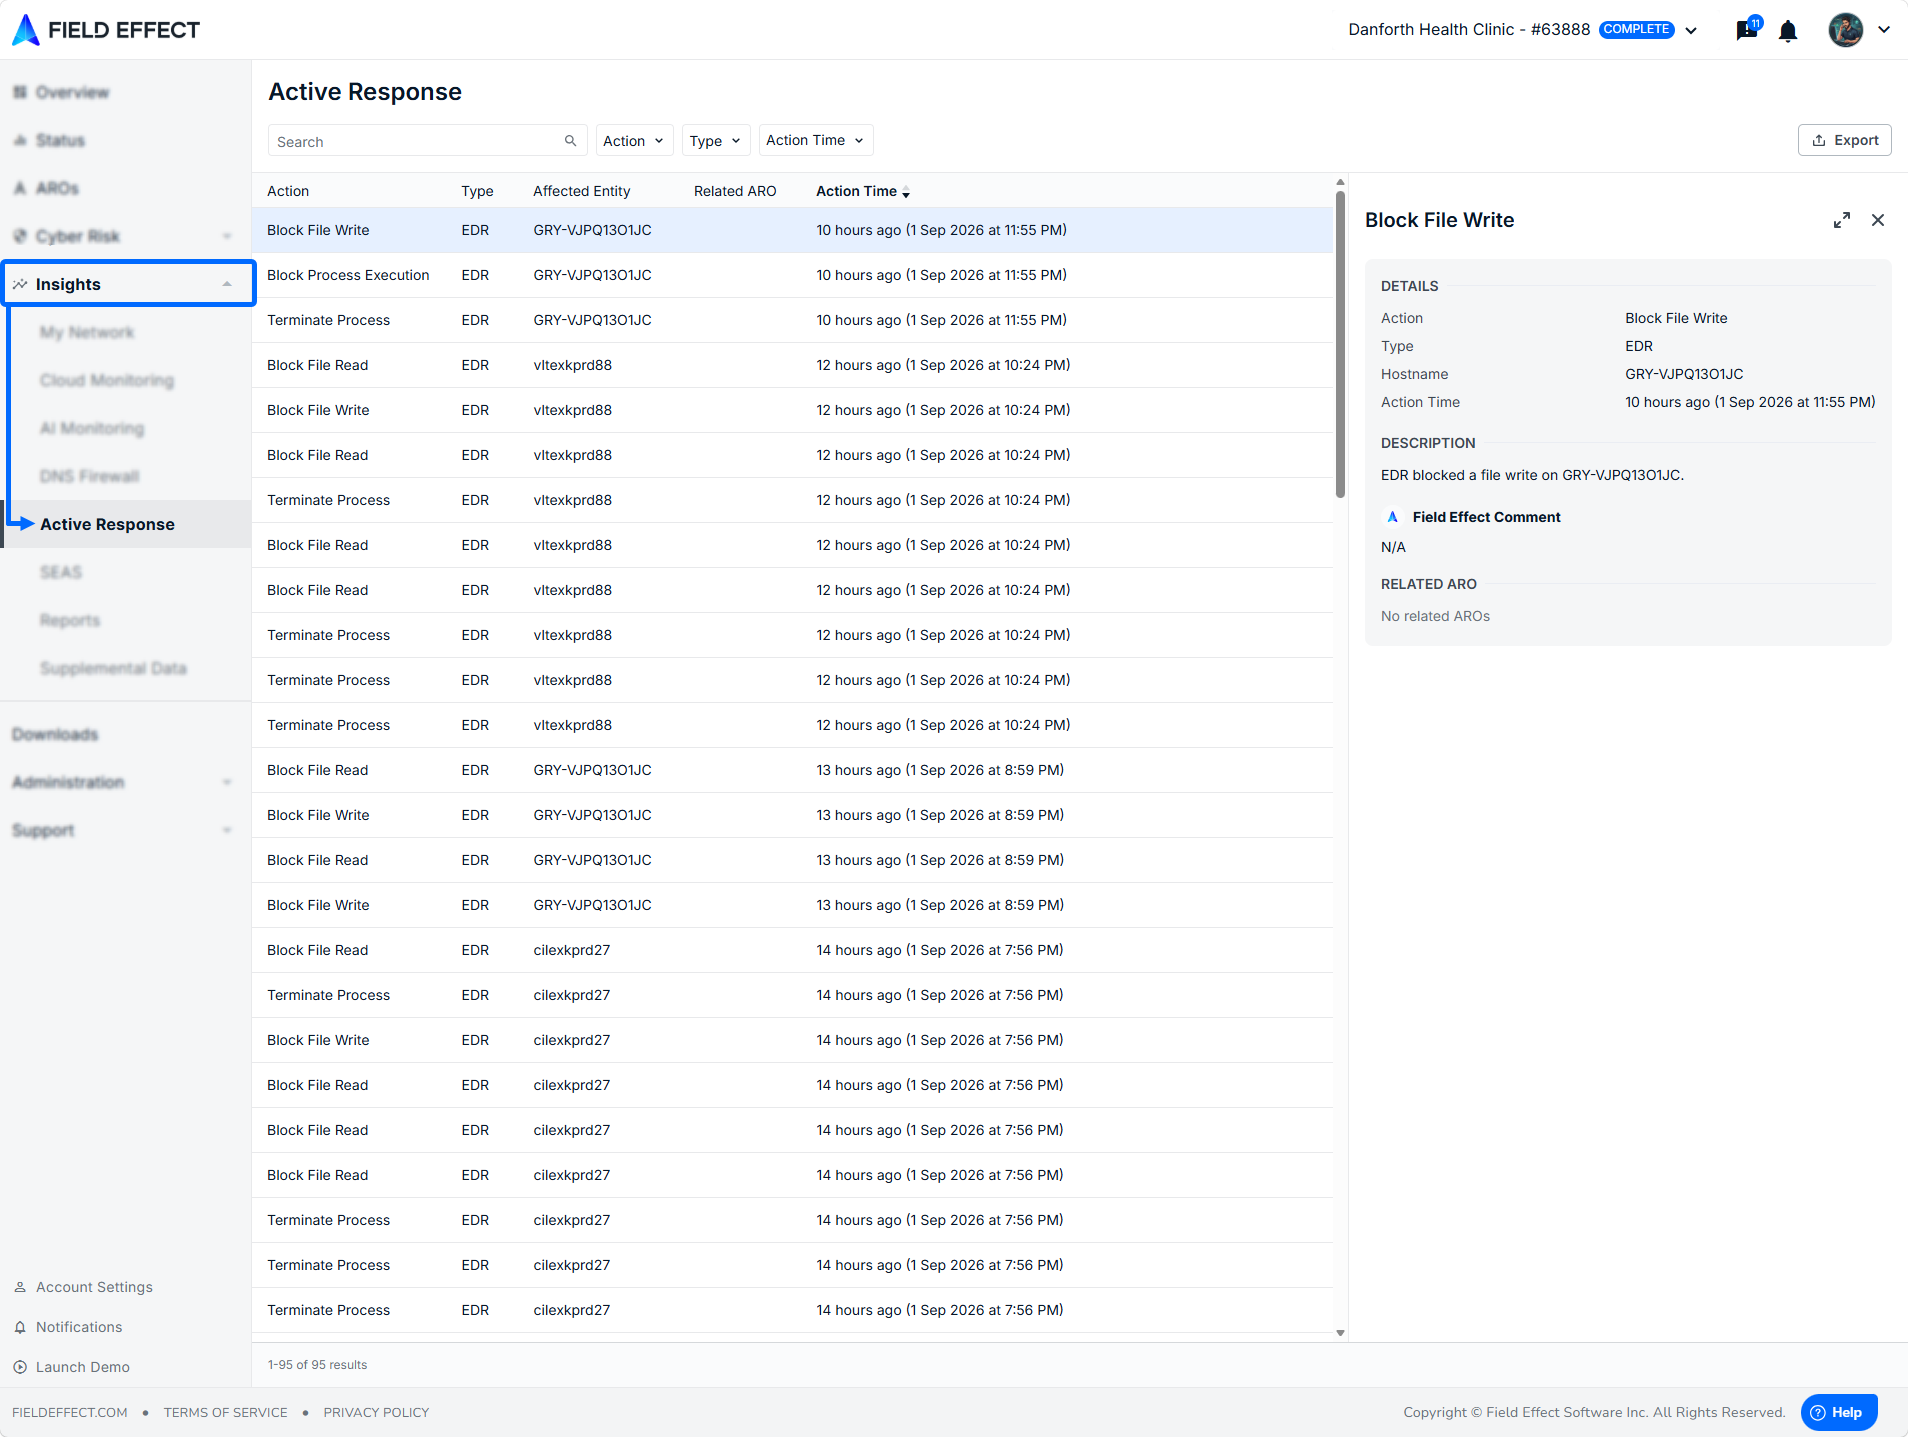
The Active Response view in the MDR Portal and Mobile app provides a centralized record of all response actions that were triggered for your organization. Use this view to monitor actions, investigate details, and validate remediation outcomes.
Related Articles:
SEAS
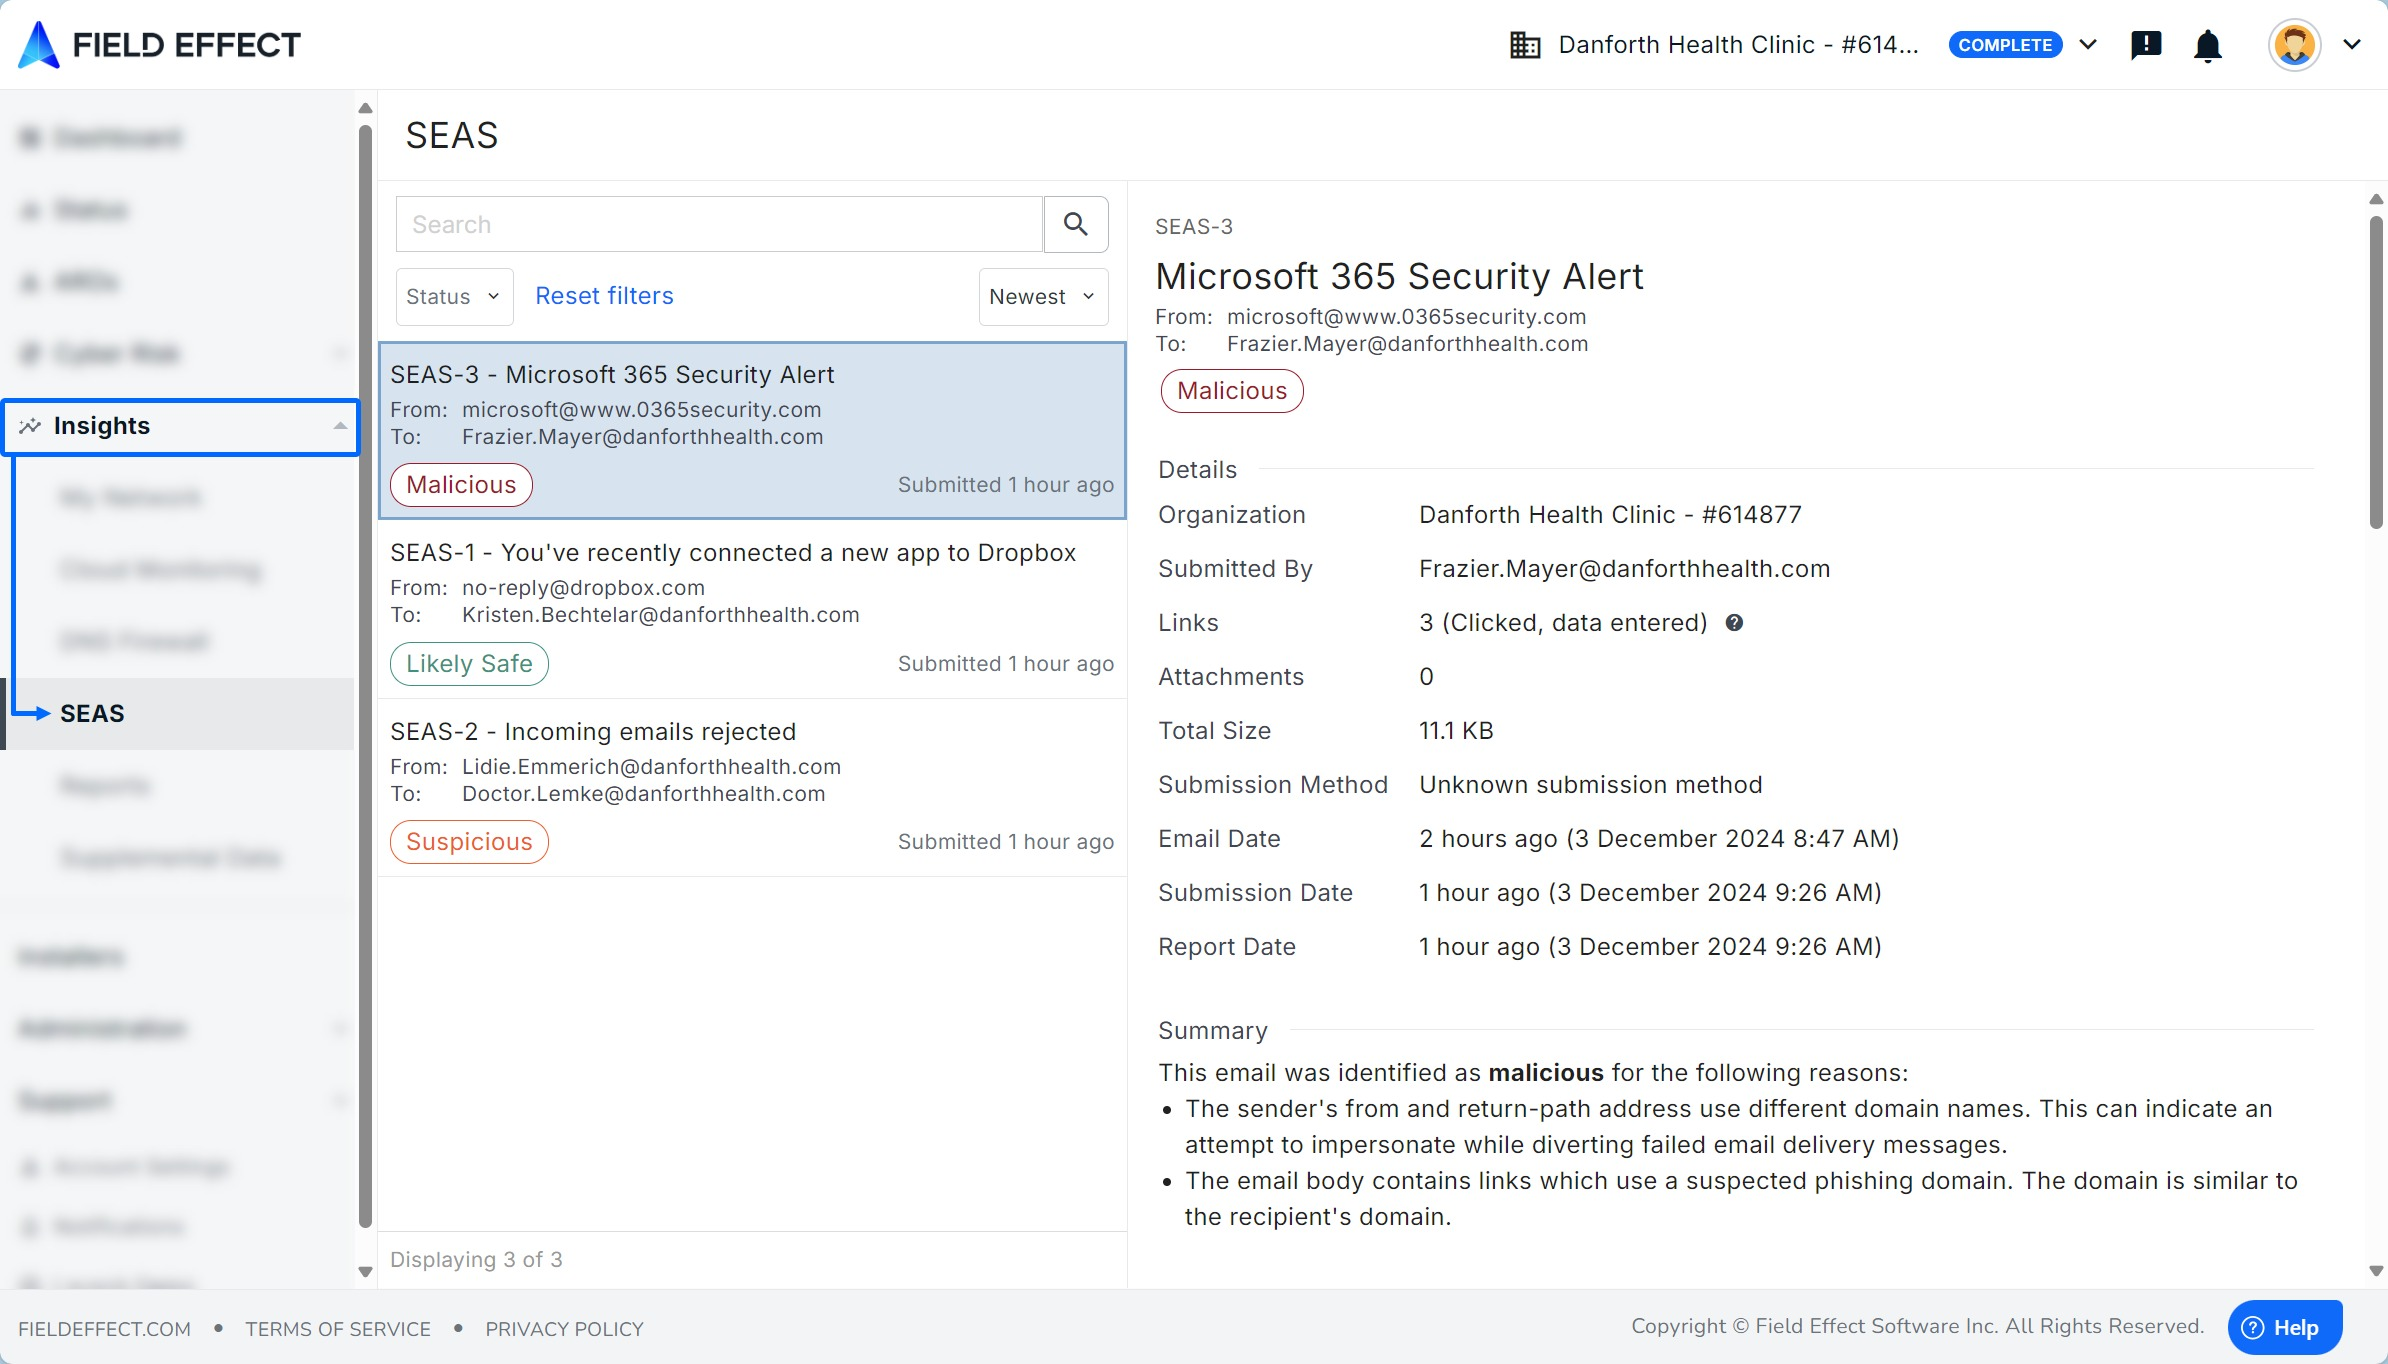
The SEAS page allows you to review emails submitted through the Suspicious Email Analysis Service (SEAS), understand why messages were classified as safe, suspicious, or malicious, and investigate related security activity within your organization.
Related Articles:
Was this article helpful?
That’s Great!
Thank you for your feedback
Sorry! We couldn't be helpful
Thank you for your feedback
Feedback sent
We appreciate your effort and will try to fix the article