Introduction
Partners: This page, and the Insights section as a whole, are only available when the organization selector is set to a specific client view.
Use the My Network page to monitor network activity across your organization, review traffic trends, and identify security events detected within your environment.
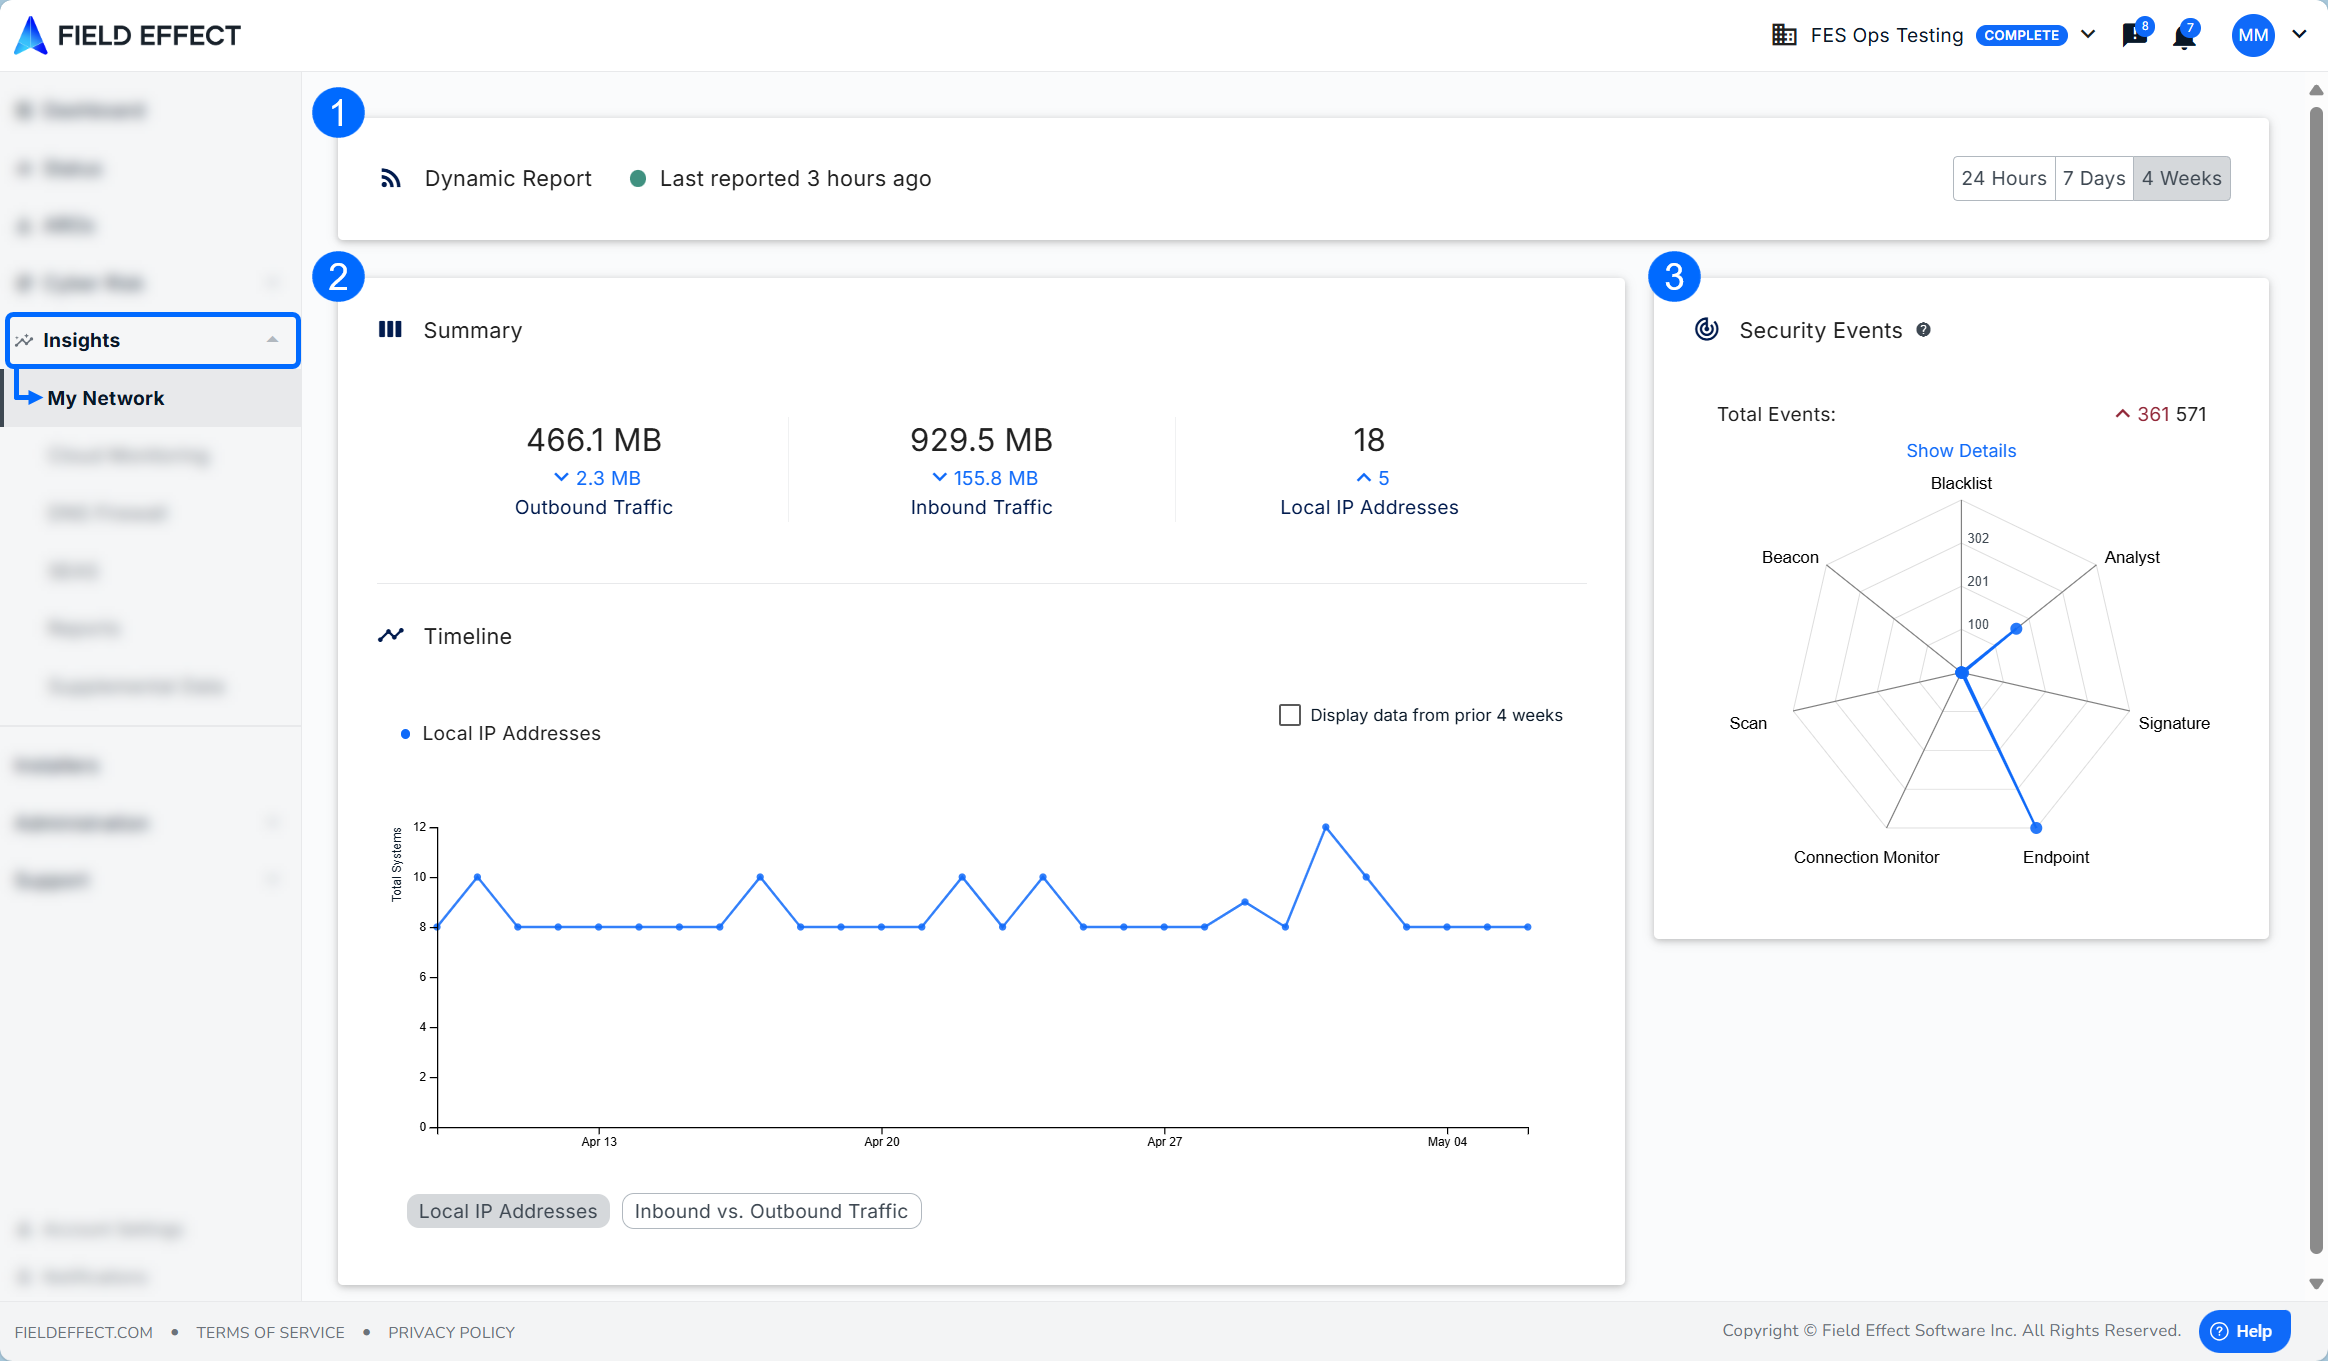
The My Network page includes the following sections:
- Status & Time Range – Displays network status and allows you to select the reporting period.
- Summary – Shows network traffic trends and traffic distribution across monitored IP addresses.
- Security Events – Displays detected security events by category and frequency.
Status & Time Range
The Status & Time Range section appears at the top of the page and includes:
- A network status indicator.
- A time range selector.
Use the time range selector to view data from:
- Last 24 hours
- Last 7 days
- Last month
Changing the time range updates all information displayed on the page, allowing you to review both recent activity and longer-term trends.

Traffic Summary
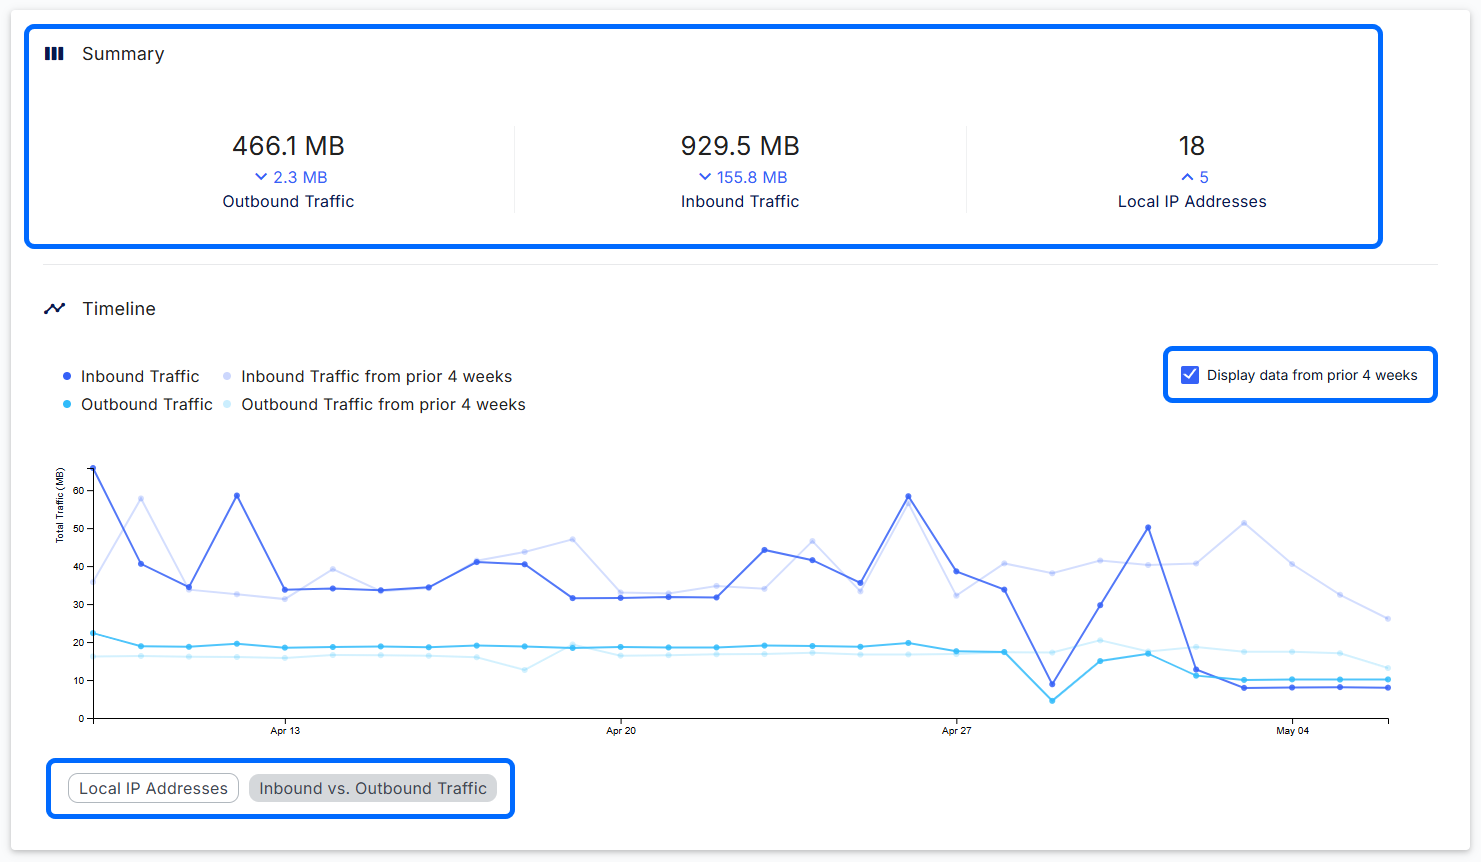
The Summary graph provides a high-level view of network activity across your monitored environment.
You can use this graph to:
- Review inbound and outbound traffic trends.
- Identify unusual changes in traffic volume.
- Compare current activity with previous periods.
- Examine traffic associated with local IP addresses.
Depending on the selected view, the graph can display:
- Inbound vs. Outbound Traffic
- Local IP Address Traffic
Data is displayed over time, helping you identify trends and changes in network behavior.
Security Events
Note: Security event counts represent observed activity within your environment. Not every security event generates an ARO. Some events are automatically determined to be benign or are used to support other detections.
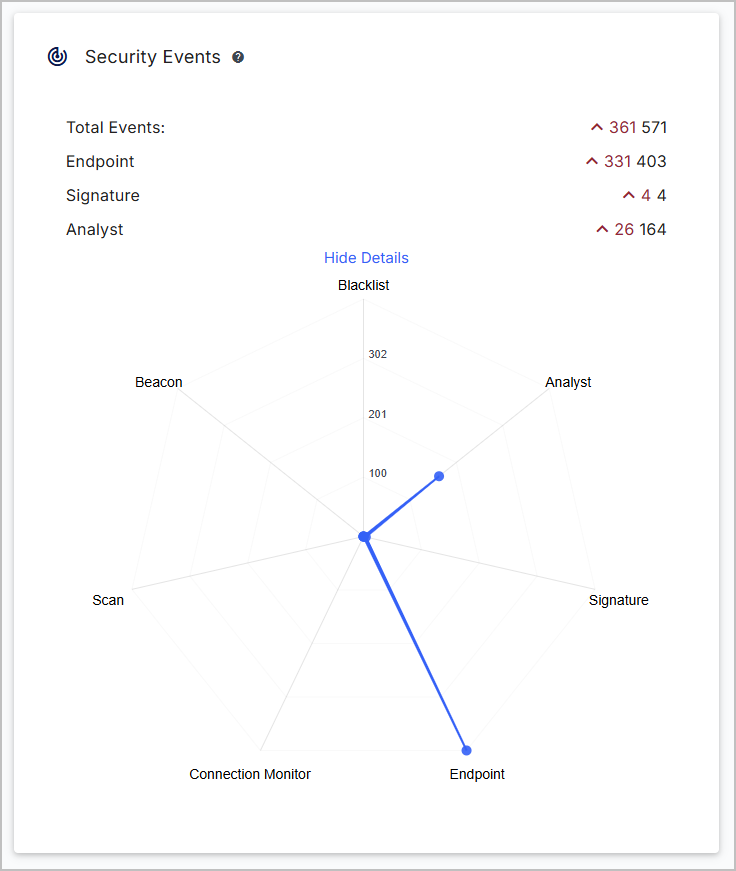
The Security Events chart displays the types and frequency of security events detected during the selected time range.
Each data point represents a specific event category. The farther a data point extends from the center of the chart, the more frequently that event type occurred during the selected period.
Select Show/Hide Details to display additional information about each event category.
Understanding Security Event Types
Thew following sections provide definitions and context for the security event types you may encounter on this page.
Blacklist
Blacklist events occur when network activity matches known indicators, such as malicious domains or IP addresses, identified by security researchers and threat intelligence sources.
Because threat intelligence indicators can occasionally produce false positives, these events are generally evaluated alongside other security data before conclusions are drawn.
Beacons
Beacon events represent recurring communications between systems in your environment and external systems on the internet.
While many legitimate applications use beaconing behavior for updates and connectivity, attackers may also use beaconing techniques for command-and-control communications or data exfiltration.
Scans
Scan events indicate that external systems have attempted to identify or gather information about systems in your environment.
Although much scanning activity is benign, it is often associated with reconnaissance activity that can precede an attack.
Endpoint
Endpoint events originate from endpoint agents and include:
- Events that directly trigger AROs
- Suspicious process activity
- Other endpoint-related behaviors that may require investigation
As a result, you may see more endpoint events than endpoint-related AROs.
Signature
Signature events are generated when network activity matches known detection signatures.
These signatures can identify malicious behavior with high confidence and may generate an ARO. However, some signature detections are later determined to be benign and do not result in an ARO.
Analyst
Analyst events represent activity identified by Field Effect analytics and detection models.
This category includes:
- Emerging analytics
- Validation events
- Security observations used to support other detections
- Operational issues such as patching or service configuration concerns
Because these events serve different purposes, analyst event counts are often higher than the number of related AROs.
Was this article helpful?
That’s Great!
Thank you for your feedback
Sorry! We couldn't be helpful
Thank you for your feedback
Feedback sent
We appreciate your effort and will try to fix the article