Introduction
The Local Systems page (Network section) is presented as a list view driven by network sensor data that provides information about unique systems observed by a network senor. And, if possible, this data will be correlated back to an endpoint device with an endpoint agent installed.
This article introduces the Local Systems page and how to navigate it, as well as how to use the predictive search functionality, edit and filter columns, and sort the view.

Navigating the Local Systems Page
The List View
The main page of this view is a table showing local systems Field Effect has identified in an organization’s environment. Columns can be resized, rearranged, and shown or hidden to suit your needs.
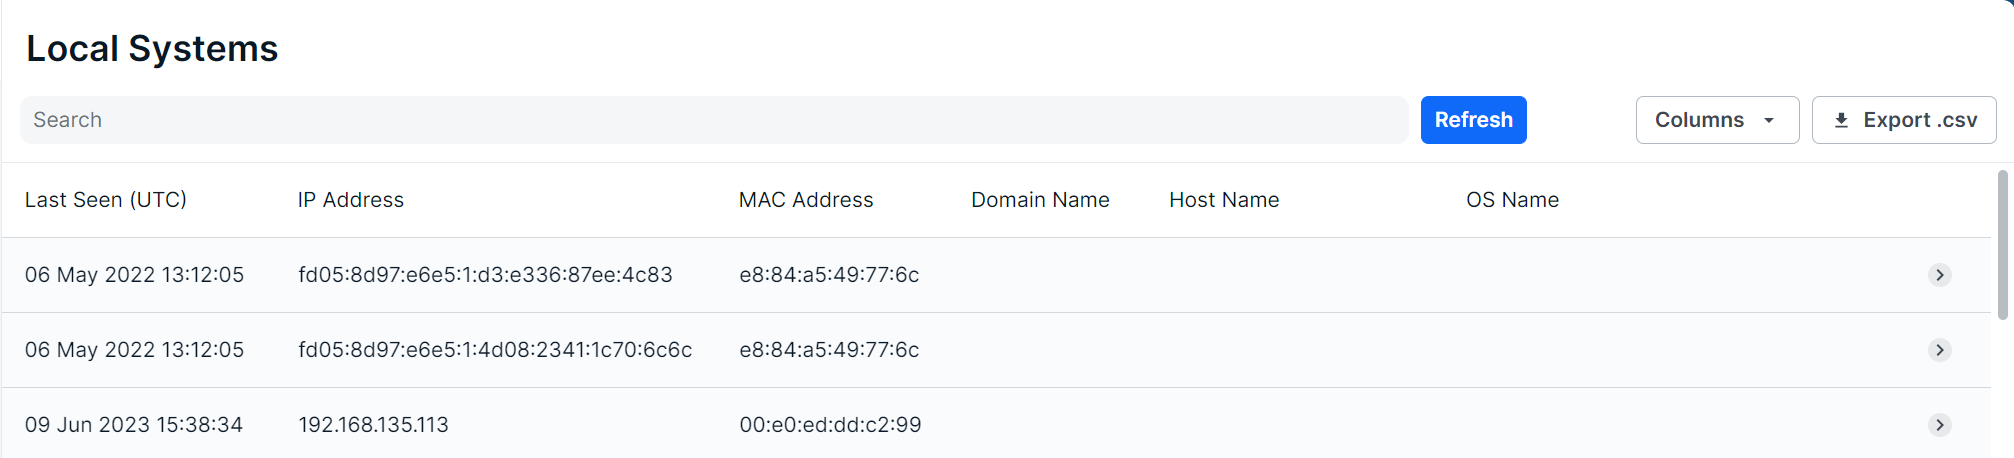
The following columns are available for the Local Systems page: DHCP, Domain Name, First Seen (UTC), Host Name, IP Address, Last Seen (UTC), MAC Address, NetBIOS, OS Name, SSDP, Serial Number.
The Details View
Clicking a row will expose more details about the selected endpoint agent along bottom of the table.

The Details view can also be expanded into a modal view using the Expand icon. Clicking the Host Name link will take you to a drilled in view of the endpoint agent on the Agents page.

Editing Columns
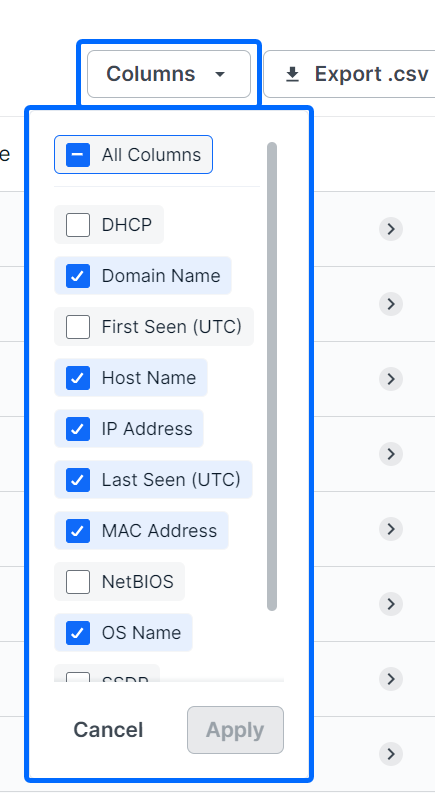
Columns can be shown or hidden to suit your needs. To edit a view’s columns, click Edit Columns from the view you want to adjust. The Edit Columns tool will open, listing all the columns available. Use the checkmarks to select the columns you want to use in the table. Uncheck columns will not be visible. Once you’ve made your selections, click Apply.
The size of each column can also be adjusted. Use the arrows in the column header to sort and drag the edge of the column to adjust the width.

Searching for Local Systems
The search bar leverages logic that allows you to create custom queries to find and filter systems. You can select from default queries (Systems with Agents, Systems Without Agents), use logic to create your own searches (Column contains XYZ), or perform keyword searches.

After selecting a suggested column from the dropdown, suggested logic statements will become visible. Select the logic statement that suites your search to continue.

After selecting a logic statement, suggested search choices, specific to the selected column, will become visible. In the example below, the user chose the Domain Name column and Contains logic statement. Therefore, the dropdown shows host names available in the list as suggestions.
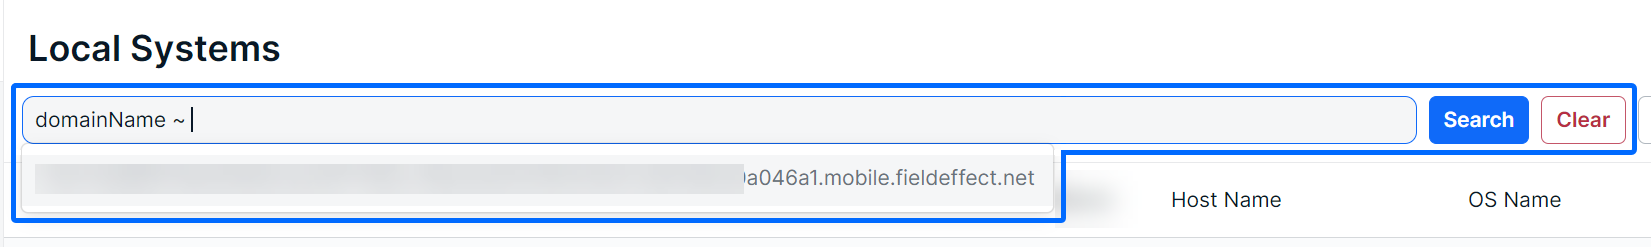
Also note that you are not restricted to suggestions, you can add custom search queries to logic statements, or perform basic keyword searches.

Sorting & Filtering Local Systems
To sort the list, click on a column header to toggle between a descending or ascending order for the selected column. You can also use the “Order By” feature shown as a suggested search function.
To filter the list, you can use the “Is Not” or “Is Null” suggestions. Using “Is not” will query results that do not include selected suggestions or provided keywords. The “Is Null” suggestion will query items with no content in the selected column.
As you make selections, you will be prompted with suggestions as shown above in Searching for Local Systems.
If you want to filter this page by a specific time or date, the following date formats are supported:
- 2022-11-22T16:35:42
- 2022-11-22T16:35:42Z
- 2022-11-22T16:35:42.000
- 2022-11-22T16:35:42.000+0000

Exporting Results
You can export the entire list of alerts, or a filtered subsection, using the Export .csv icon.

Was this article helpful?
That’s Great!
Thank you for your feedback
Sorry! We couldn't be helpful
Thank you for your feedback
Feedback sent
We appreciate your effort and will try to fix the article