Introduction
The DNS Activity page (Network section) consists of two table views: DNS Requests and DNS Resolutions. This is a great resource for:
- Looking up domain requests observed by a network sensor.
- Correlating domain requests to IPs making a domain request.
This article introduces the page how to navigate it, as well as how to use the search functionality, customizing columns, and sorting the page’s table view.
This article introduces the page how to navigate it, as well as how to use the search functionality, customizing columns, and sorting the page’s table view.

Navigating the DNS Activity Page
The List View
The DNS Activity page is presented as a table with each row representing a either a DNS request that was made or a DNS request that was resolved, depending on the selected view; DNS Requests or DNS Resolutions.
The DNS Requests view includes the following columns: Domain Name, Name Server, Requested (UTC), Requester, and Resolved IP.

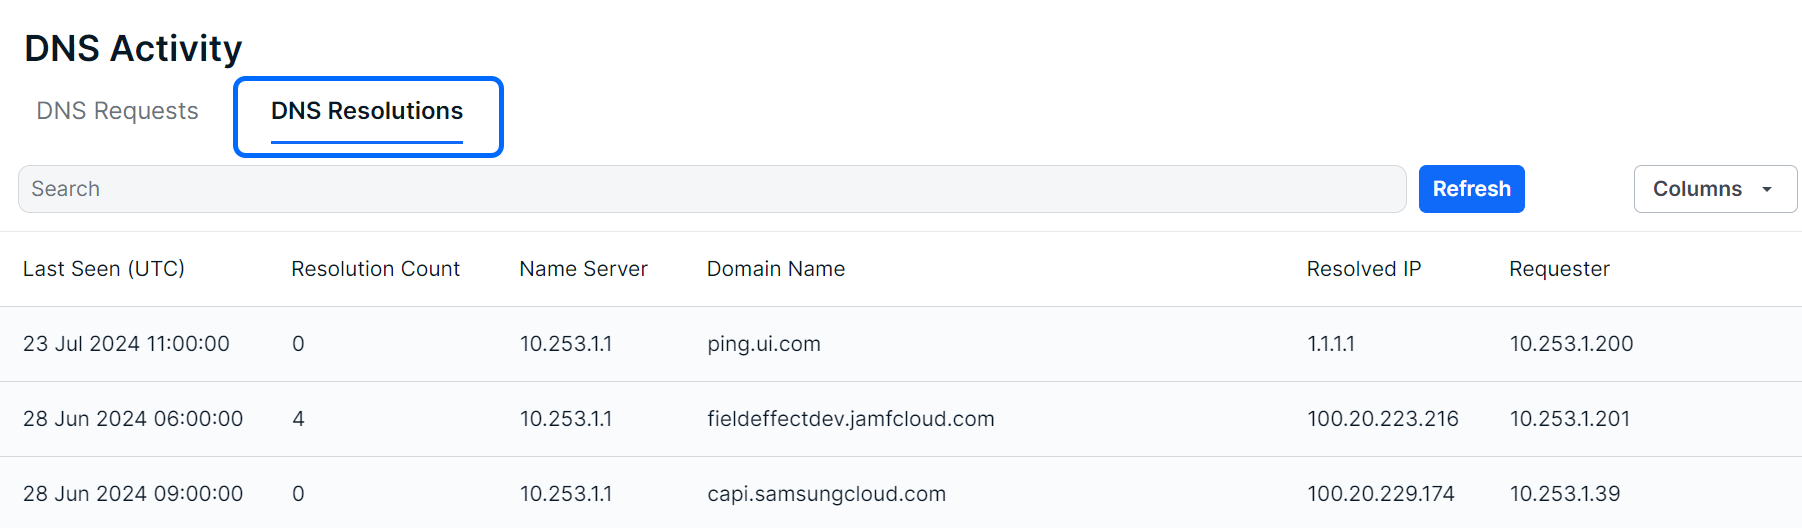
The DNS Resolutions view includes the following columns: Domain Name, First Seen (UTC), Last Seen (UTC), Name Server, Name Server Count, Requester, Requesters, Resolution Count, Resolved IP.
The Details View
Clicking a row will expose more details about the selected DNS request or resolution instance along bottom of the table.

The Details view can also be expanded into a modal view using the Expand icon.

Editing Columns
Columns can be shown or hidden to suit your needs. To edit a view’s columns, click Edit Columns from the view you want to adjust. The Edit Columns tool will open, listing all the columns available. Use the checkmarks to select the columns you want visible in the table. Unchecked columns will not be visible. Once you’ve made your selections, click Apply.

The size of each column can also be adjusted. Use the arrows in the column header to sort and drag the edge of the column to adjust the width.

Searching for DNS Activity
Note: This functionality applies to both the DNS Requests and DNS Resolutions views.
The search bar leverages logic that allows you to create custom queries to find and filter requests. You can select from suggested columns (listed above), use logic to create your own searches (“Name Server” column contains “XYZ”), or perform keyword searches.

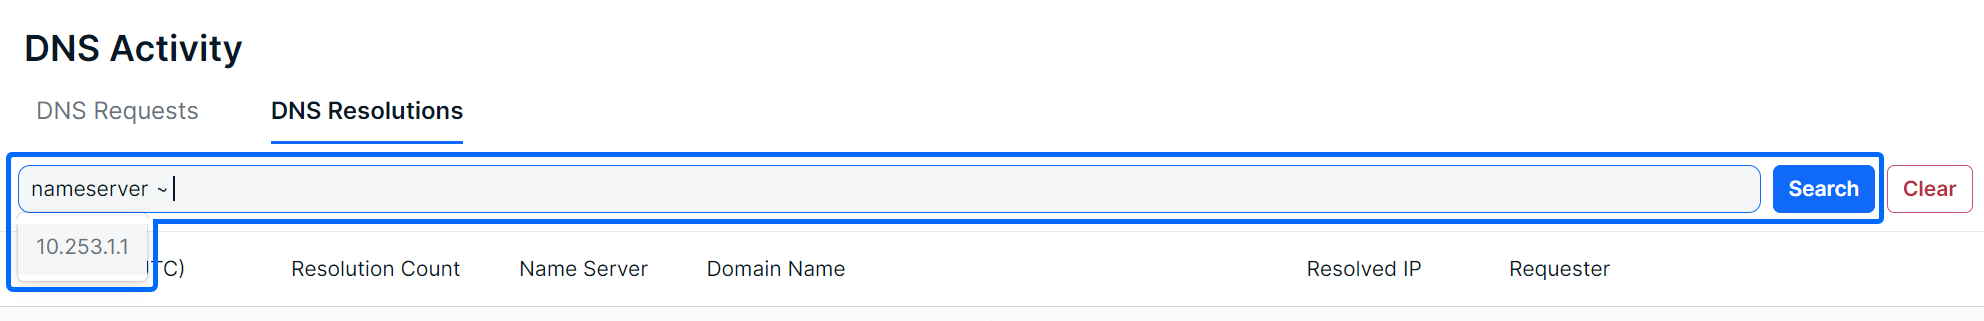
After selecting a column from the dropdown, logic statements will appear as suggestions in the dropdown. Select the logic statement that suites your search to continue.
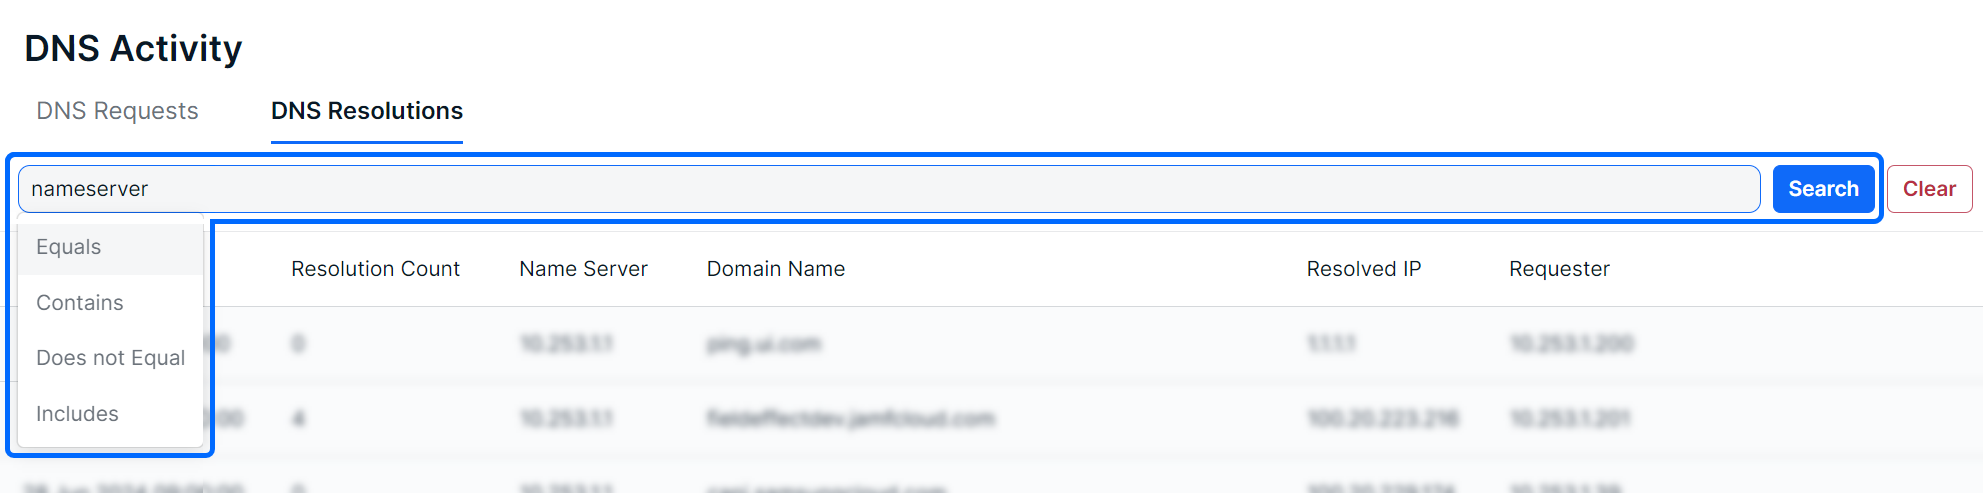
After selecting the logic statement, suggested results will become visible. In the example below, the user chose the Name Server column and Contains logic statement. Therefore, available IP addresses in the list are shown as suggestions.
Also note that you are not restricted to suggestions, you can add custom search queries to logic statements, or perform basic keyword searches.

Sorting and Filtering Requests
To sort the list, click on a column header to toggle between a descending or ascending order for the desired column. You can also use the “Order By” feature in the search results.
To filter the list, use the “Is Not” or “Is Null” suggestions. Using “Is not” will query results that do not include your selections. The “Is Null” suggestion only applies to columns and will only show results with no content in the selected column.
As you make selections, you will be prompted with suggestions as shown above in Searching for Alerts.
If you want to filter this page by a specific time or date, the following date formats are supported:
- 2022-11-22T16:35:42
- 2022-11-22T16:35:42Z
- 2022-11-22T16:35:42.000
- 2022-11-22T16:35:42.000+0000

Exporting Results
You can export the entire list of software, or a filtered subsection, using the Export .csv icon.

Was this article helpful?
That’s Great!
Thank you for your feedback
Sorry! We couldn't be helpful
Thank you for your feedback
Feedback sent
We appreciate your effort and will try to fix the article