Introduction
The Field Effect MDR Dashboard provides access to a deeper level of (read only) data stored within your MDR SIEM network sensor. To learn more about sensors, see our Help Center chapter.
This article explains the process of access your organization's MDR Dashboard.
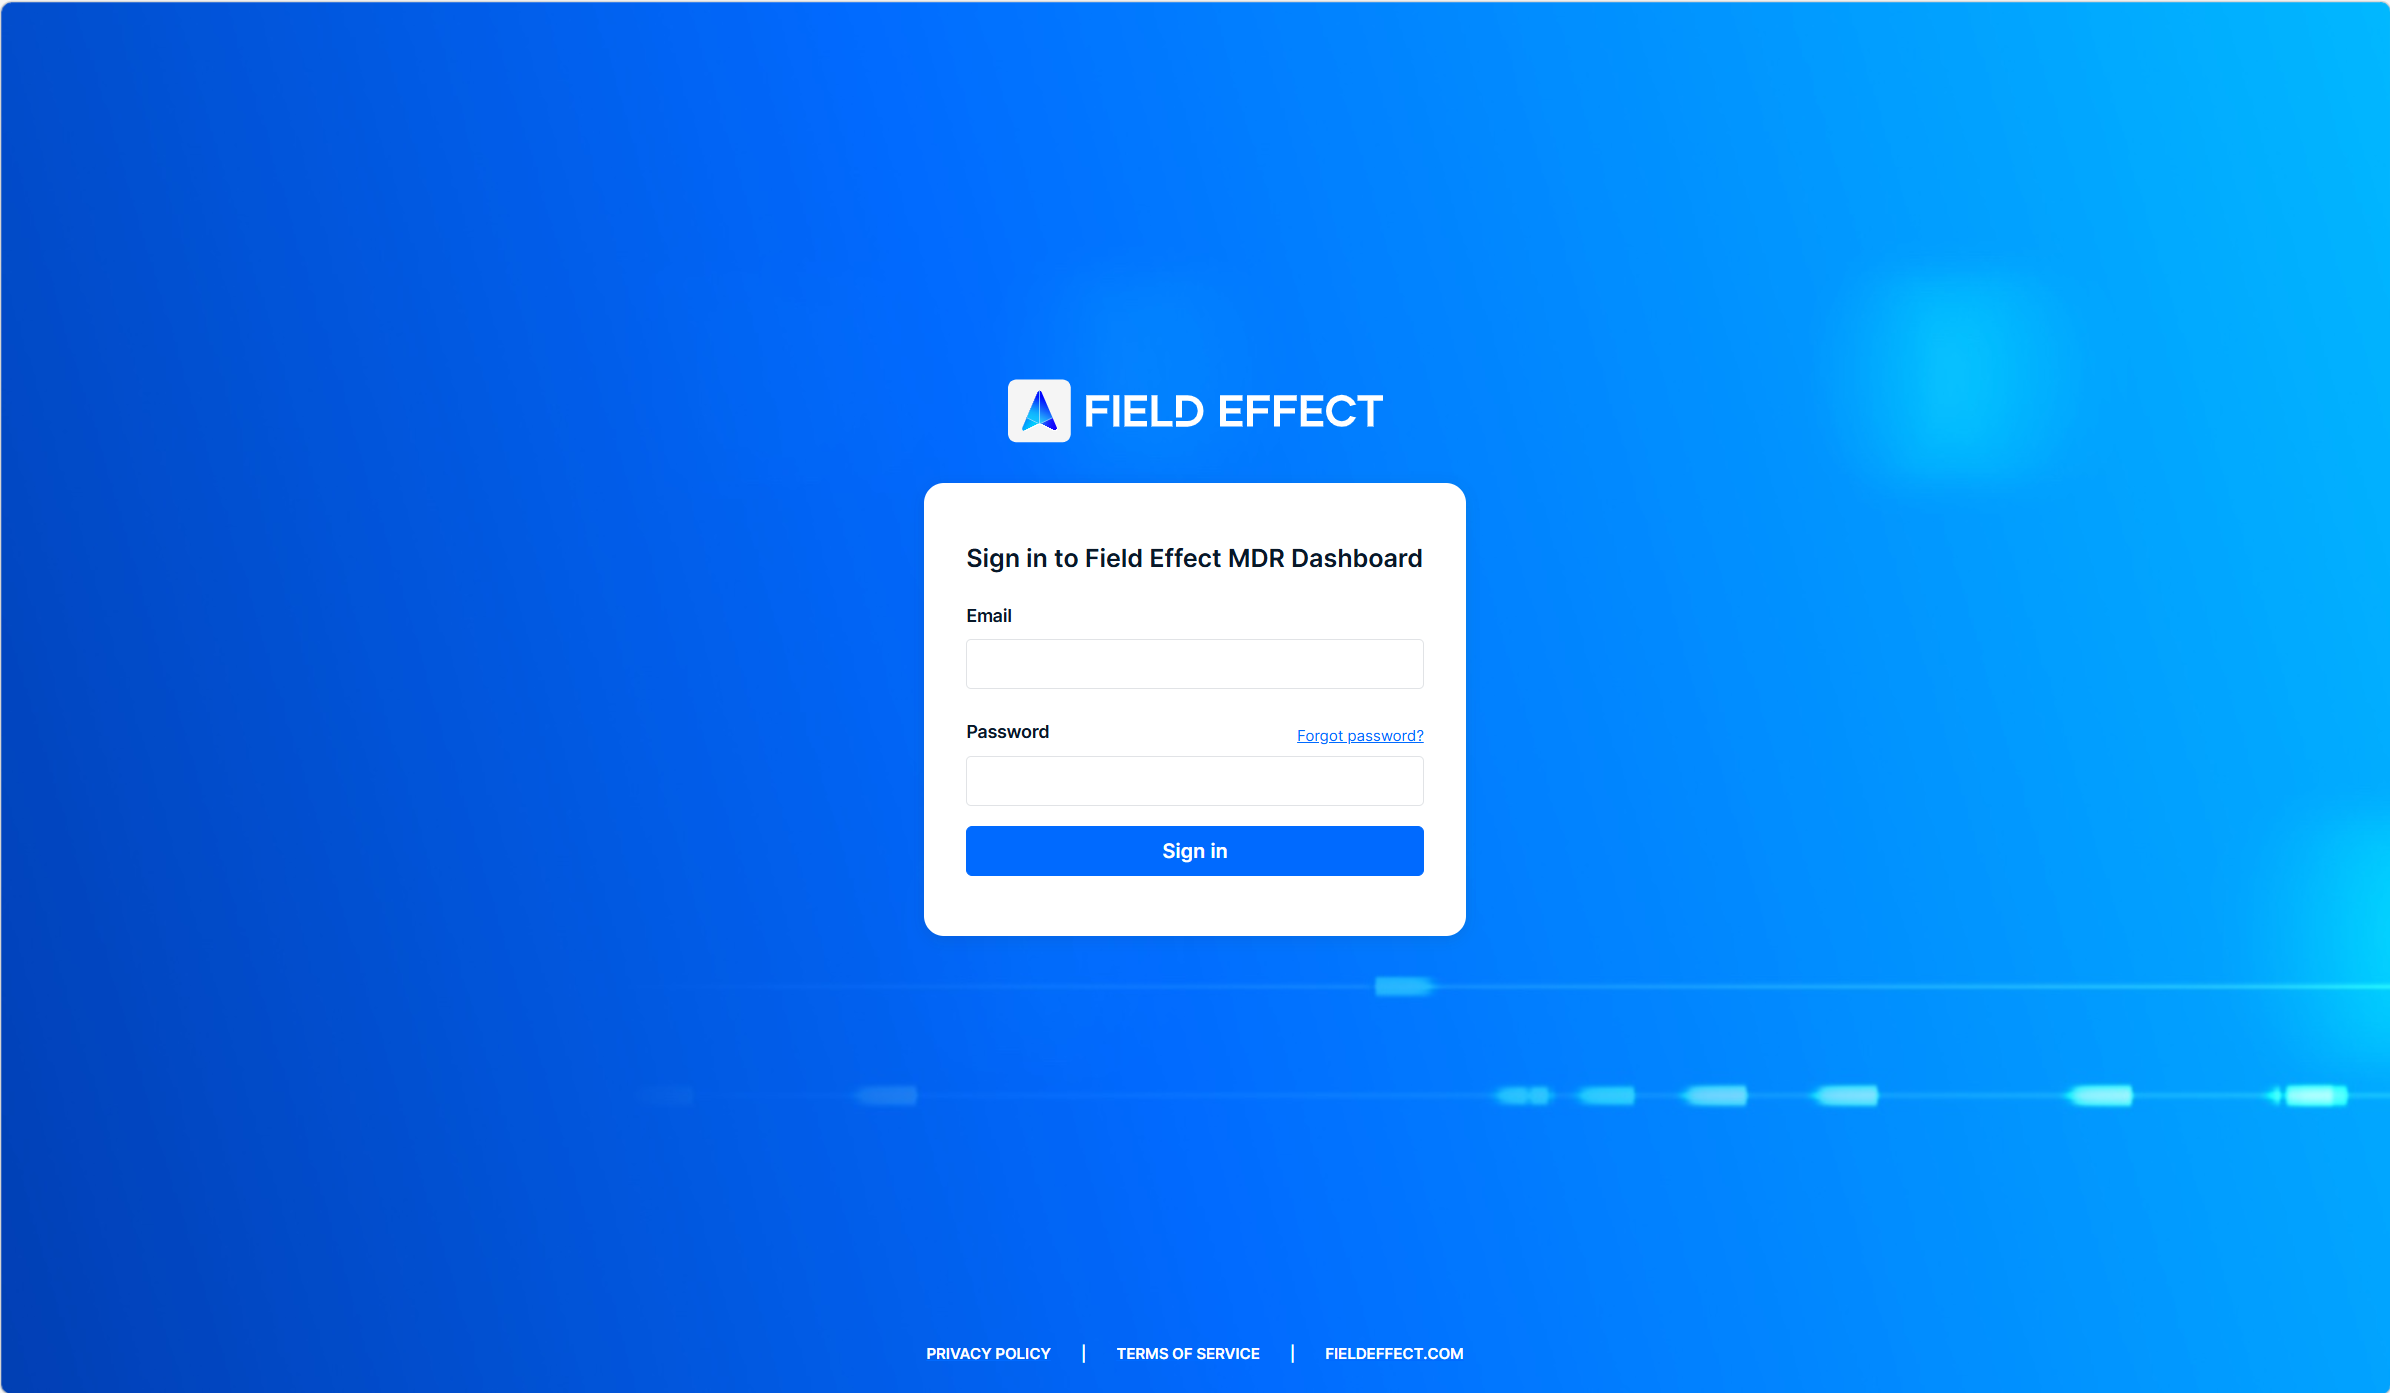
Physical & Self-Hosted Network Sensors
To access an MDR SIEM sensor's MDR Dashboard, you must be connected to the same network as the dashboard.
So, if the sensor is deployed at your organization's headquarters, you must be logged into the Headquarters network, be it physically on-site or through a VPN connection.
While on the network:
- Navigate to the senor's IP address in your internet browser.
- Example: http://192.168.0.199
- Login using your MDR Portal account credentials
If you are unsure of your appliance’s IP address, feel free to contact support@fieldeffect.com to get the appliance’s IP address.
Field Effect-Hosted Virtual Sensors
For this sensor type:
- You must be connected to the same network as your sensor
- An endpoint agent for your organization must be installed on your device
The MDR Dashboard can be accessed from within the MDR Portal. Once logged in, access it by clicking the
MDR SIEM link on the Status page.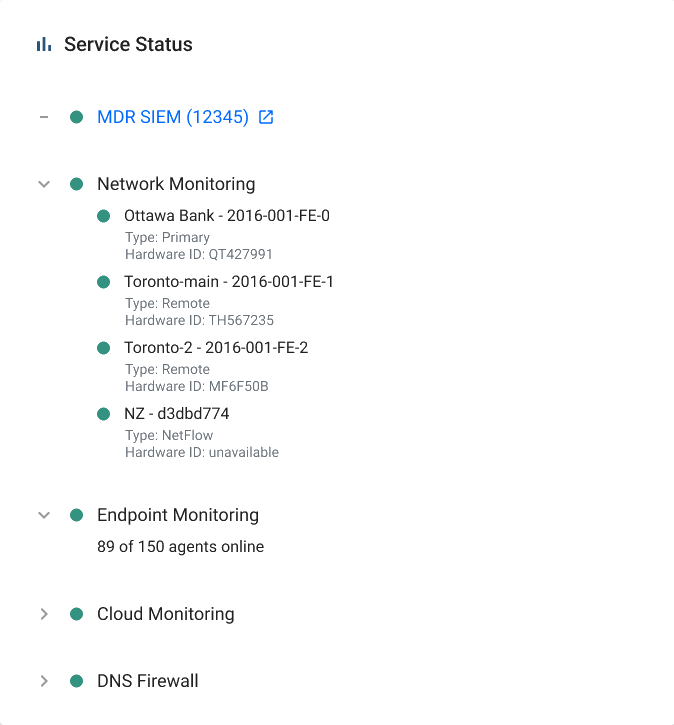
Was this article helpful?
That’s Great!
Thank you for your feedback
Sorry! We couldn't be helpful
Thank you for your feedback
Feedback sent
We appreciate your effort and will try to fix the article