Introduction
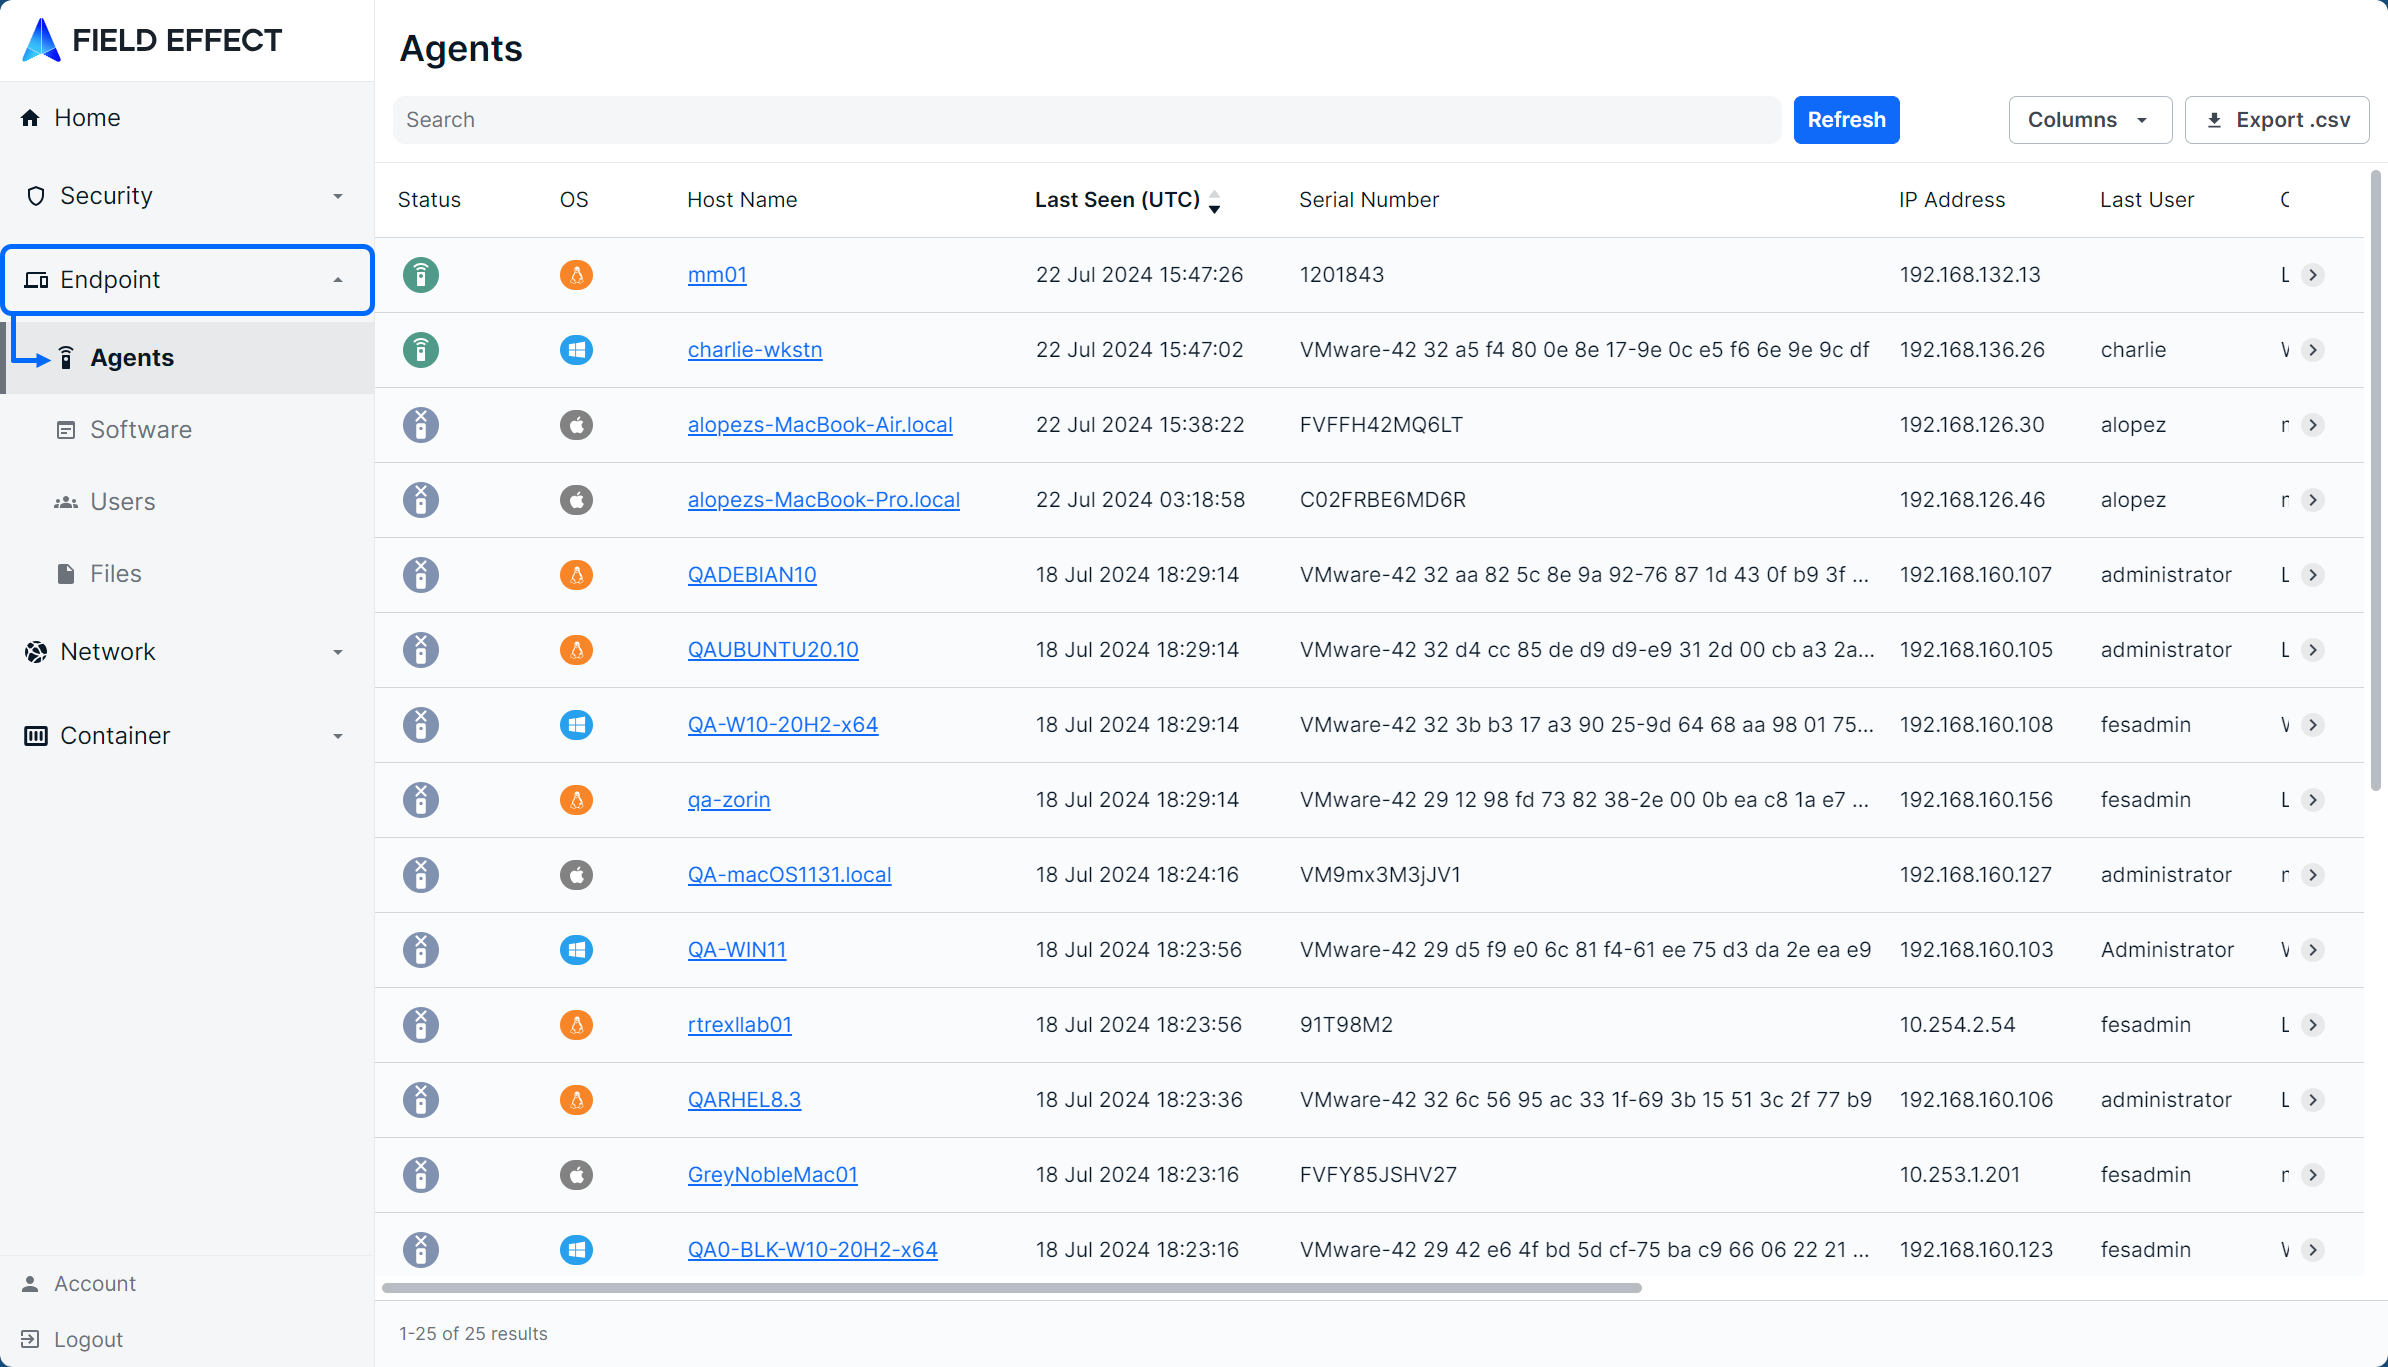
From the Appliance Dashboard’s Agent page, you can view high-level information about each endpoint device running an endpoint agent (v3.1 or later). For more in-depth telemetry about these endpoint devices, you can log into the Appliance Dashboard directly from the physical network appliance(s) deployed in your environment. Once logged in, you can use the Agents page (Endpoint section) to track specific events and get a deeper view into endpoint agent telemetry.
Given logging into the Appliance Dashboard means logging into your appliance, you must be connected to the network where the network appliance resides. See Accessing the Appliance Dashboard for more.
This article introduces the Agents page and how to navigate it, as well as how to use the predictive search functionality, edit and filter columns, and sort the view.
Navigating the Agents Page
The List View
The page is presented as a table showing all endpoint agents in an organization’s environment. Columns can be re-sized, rearranged, and shown or hidden to suit your needs.
The Details View
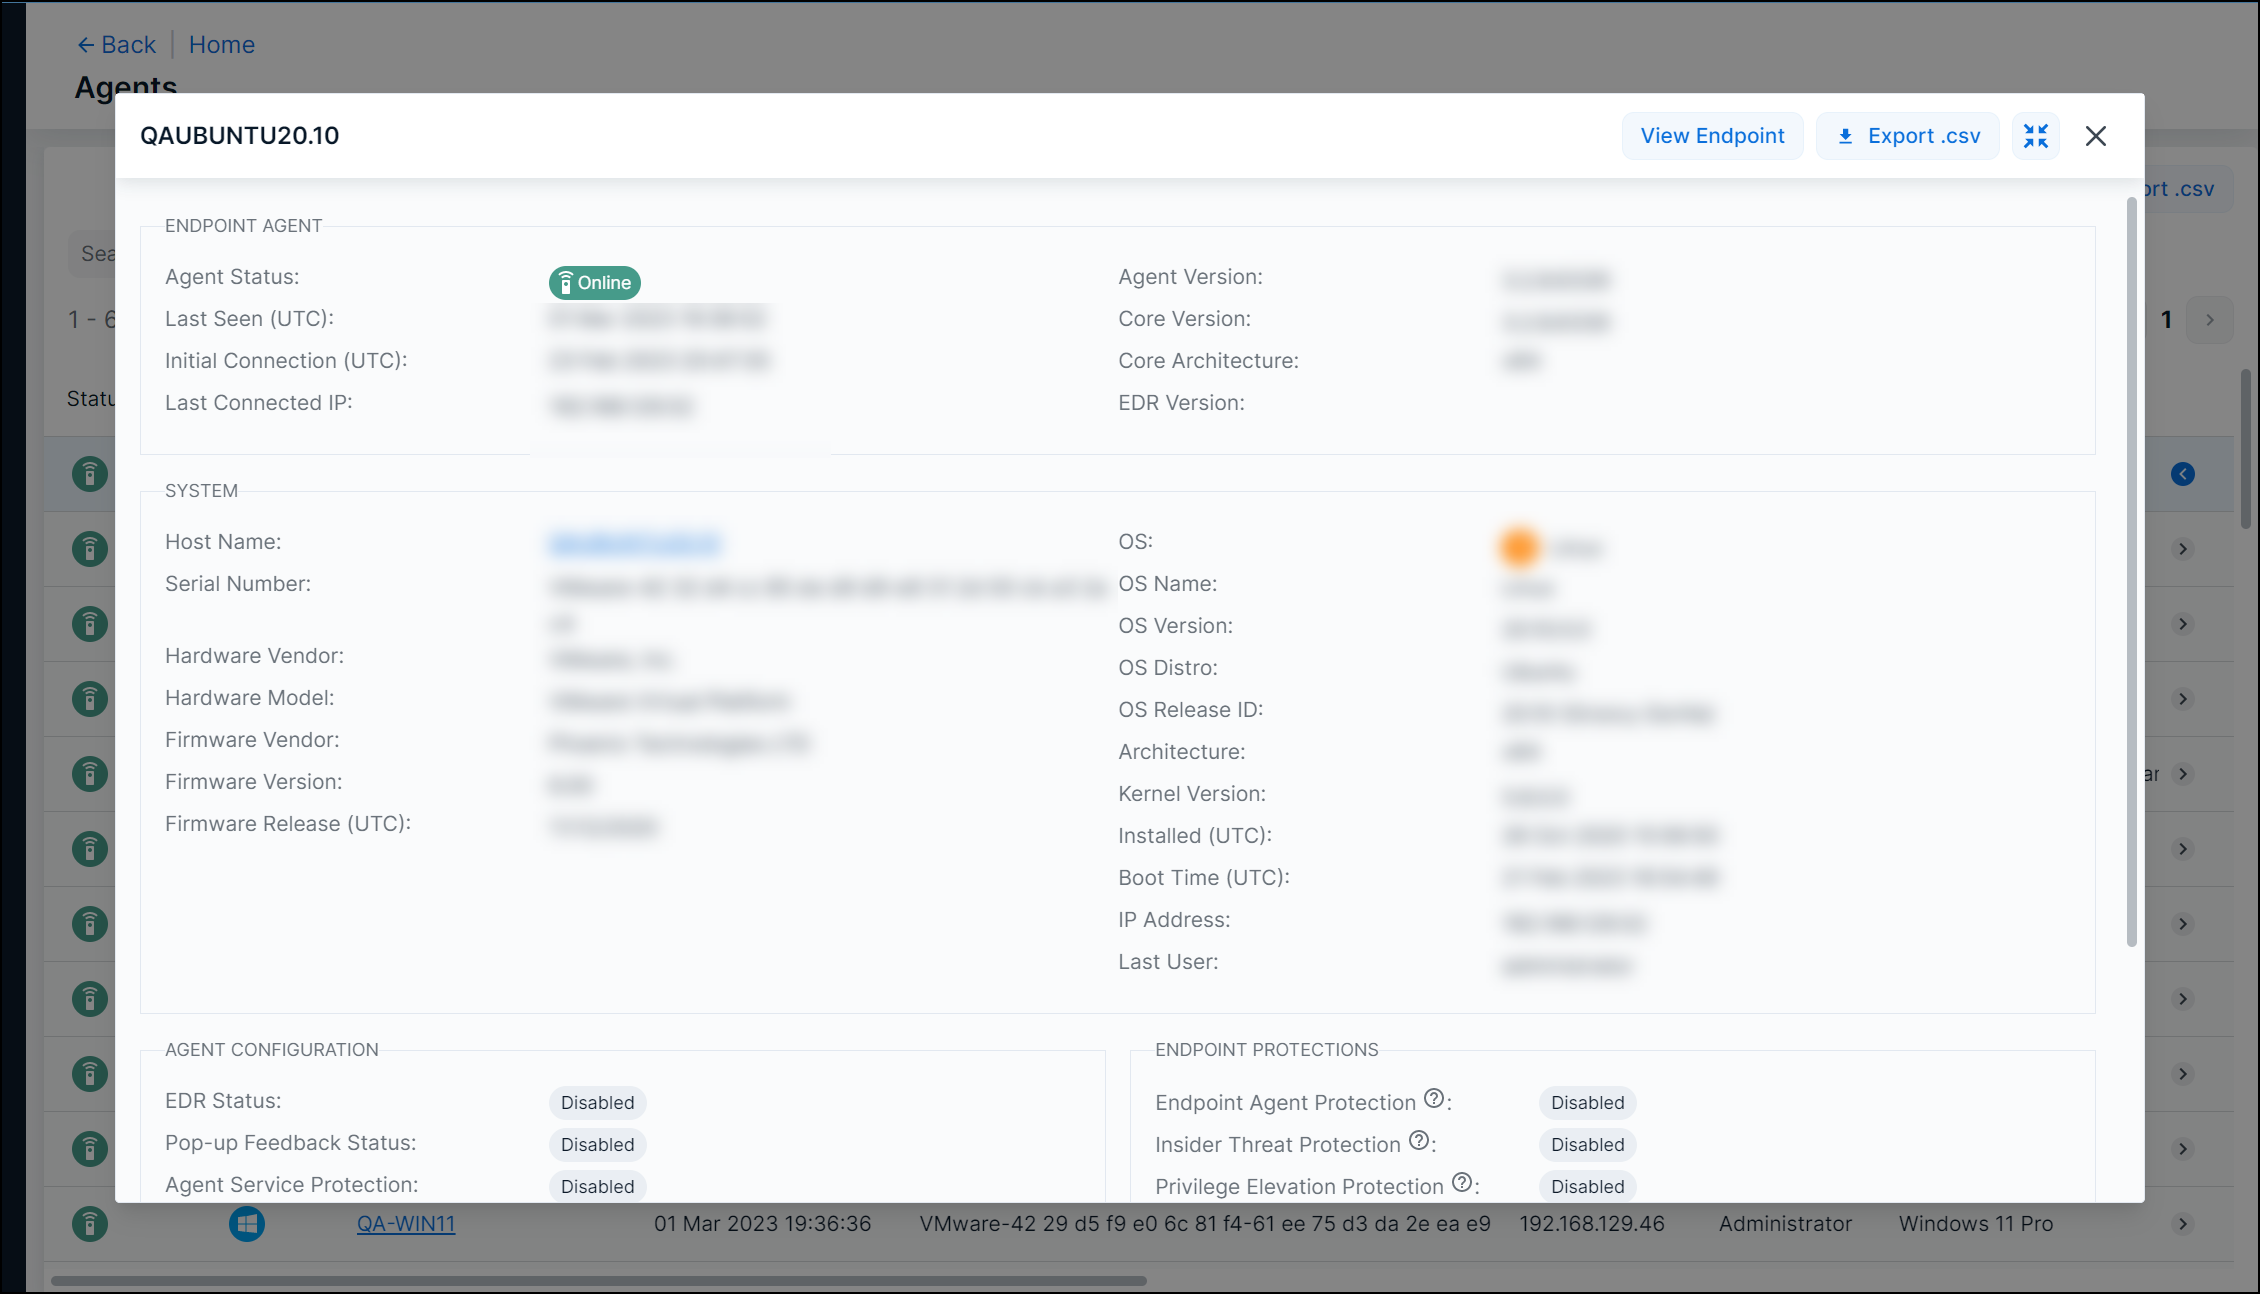
Clicking a row will expose more details about the selected endpoint agent along bottom of the table.

The Details view can also be expanded into a modal view using the Expand icon. Clicking View ARO will take you to the ARO in the Field Effect portal.
Editing Columns
Columns can be shown or hidden to suit your needs. To edit a view’s columns, click Edit Columns from the view you want to adjust. The Edit Columns tool will open, listing all the columns available. Use the checkmarks to select the columns you want to use in the table. Uncheck columns will not be visible. Once you’ve made your selections, click Apply.

Each column can also be sorted and sized. Use the arrows in the column header to sort and drag the edge of the column to adjust the width.

Drilling into an Endpoint
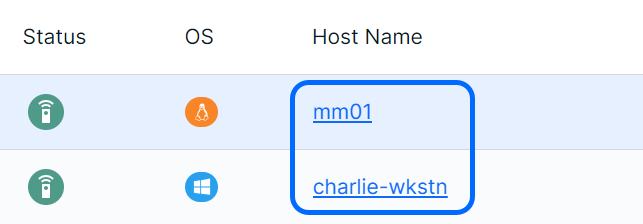
Clicking on an endpoint’s Host Name will drill further into the endpoint and expose several more views related to the specific endpoint’s telemetry.
You’ll be taken to the endpoint’s Overview, which lists out the same high-level information shown while in the Agents page’s detail view shown (above).
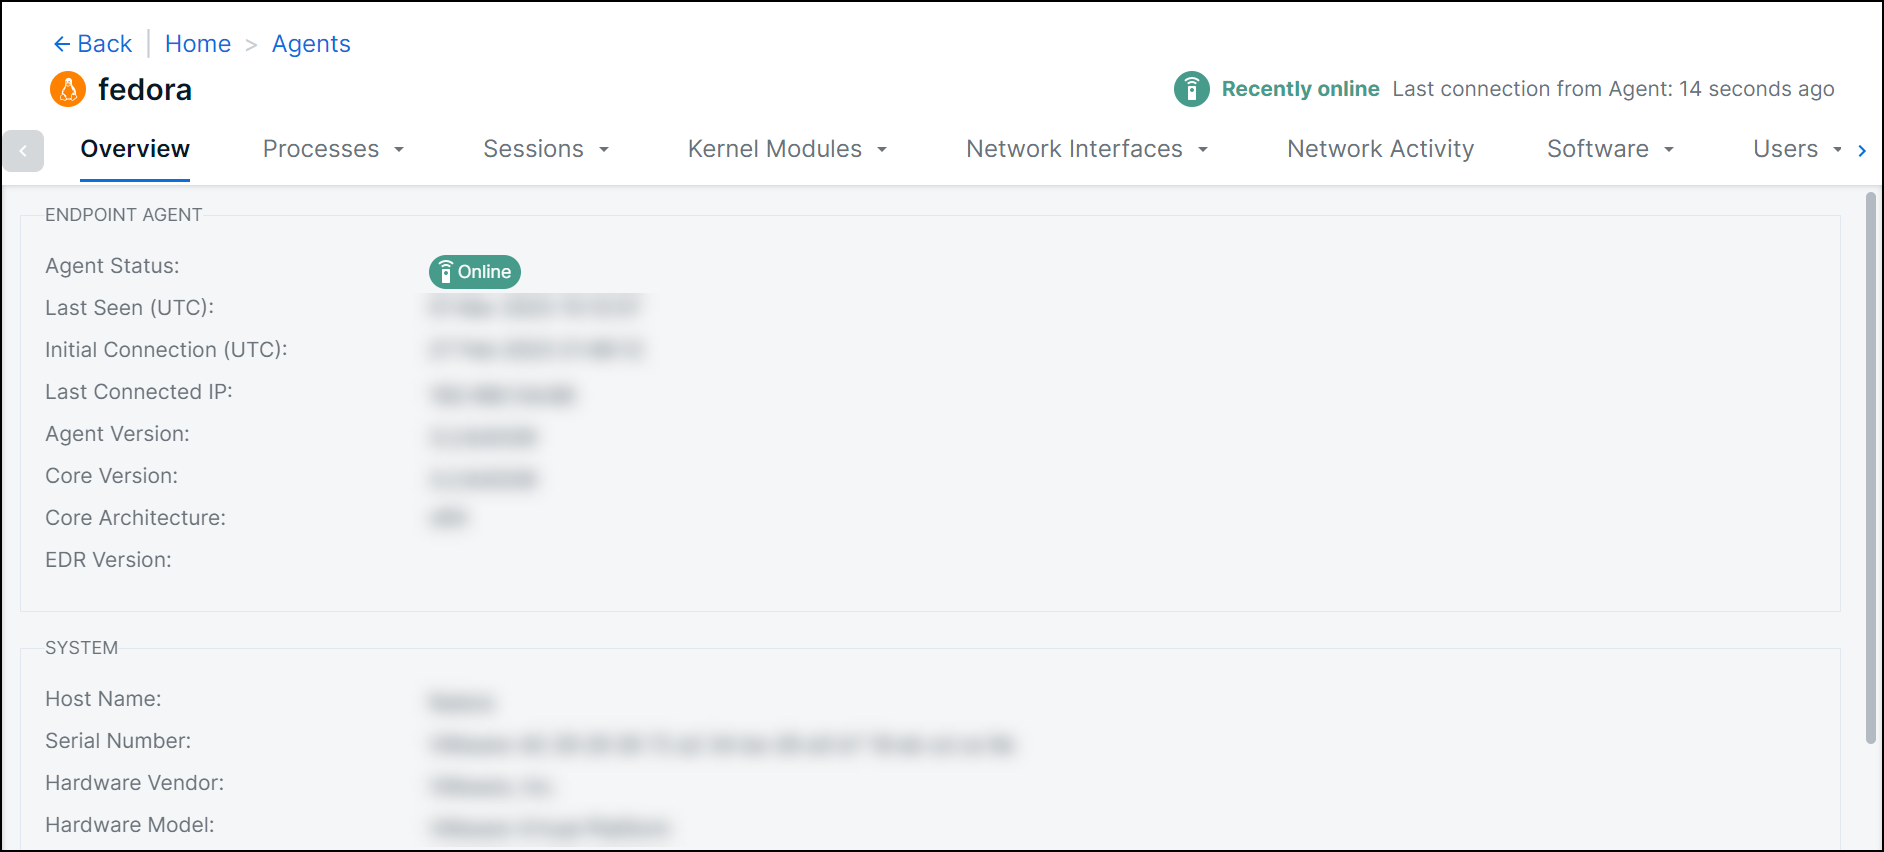
There are several more “drilled-in” views available, and they are listed along the top the page. These views are in table form and behave the same way as the Endpoint Agents view.

Clicking on a row from one of these views will open more details about the item. Like the main view, details can be expanded to a modal view using the Expand button.

Recent and Log Views
Some of the “drilled-in” views have Recent, Archive, or Log sub-views. Views with sub-views are indicated by an arrow icon in applicable view tabs. When hovering over a tab, the applicable sub-views will become visible. Log sub-views contain a list of historical events reported by the endpoint agent. Archive sub-views contains summarized historical view of process data.
The amount of retained data varies depending on the view or sub-view, but generally, a month’s worth of data is retained. For the Processes view’s Archive sub-view, two weeks of data is retained.

Searching for Agents
Note: this functionality applies to the main Agents page, as well “drilled-in” agent views and sub-views.
The search bar leverages logic that allows you to create custom queries to find alerts. You can select from default queries (No recorded end time, Has recorded end time), use logic to create your own searches (“Status” column contains “XYZ”), or perform keyword searches.

After selecting a suggested column from the dropdown, suggested logic statements become visible. Select the logic statement that suites your search to continue.
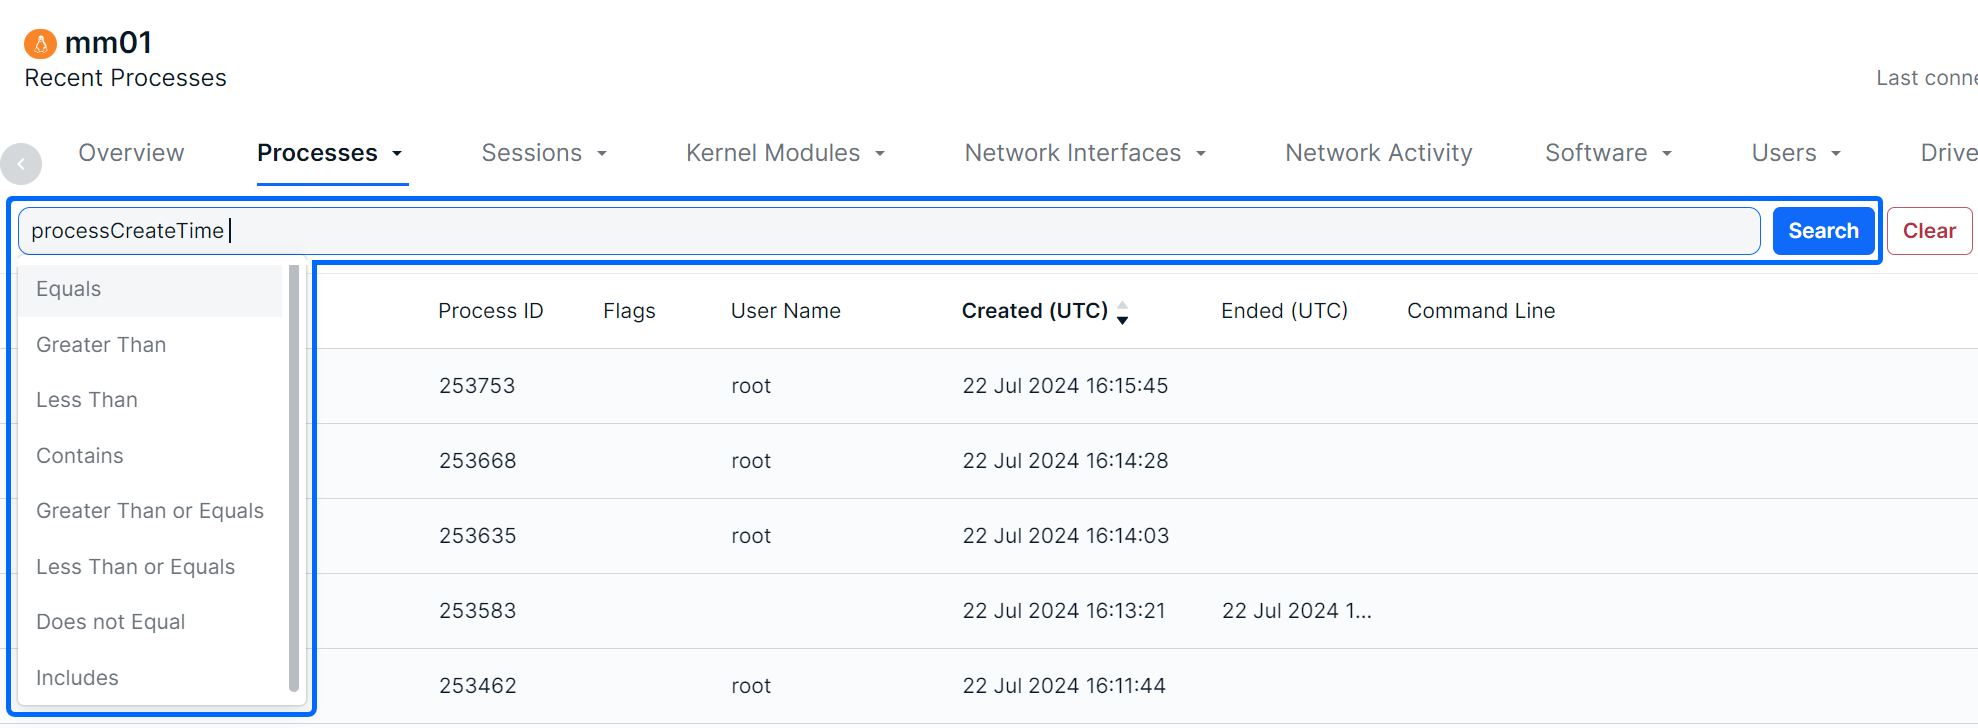
After selecting a logic statement, suggested search choices specific to the selected column will become visible. In the example below, the user chose the Created Time column and Contains logic statement. Therefore, the dropdown shows UTC times available in the table as suggestions.

Also note that you are not restricted to suggestions, you can add custom search queries to logic statements, or perform basic keyword searches.

Sorting & Filtering Agents
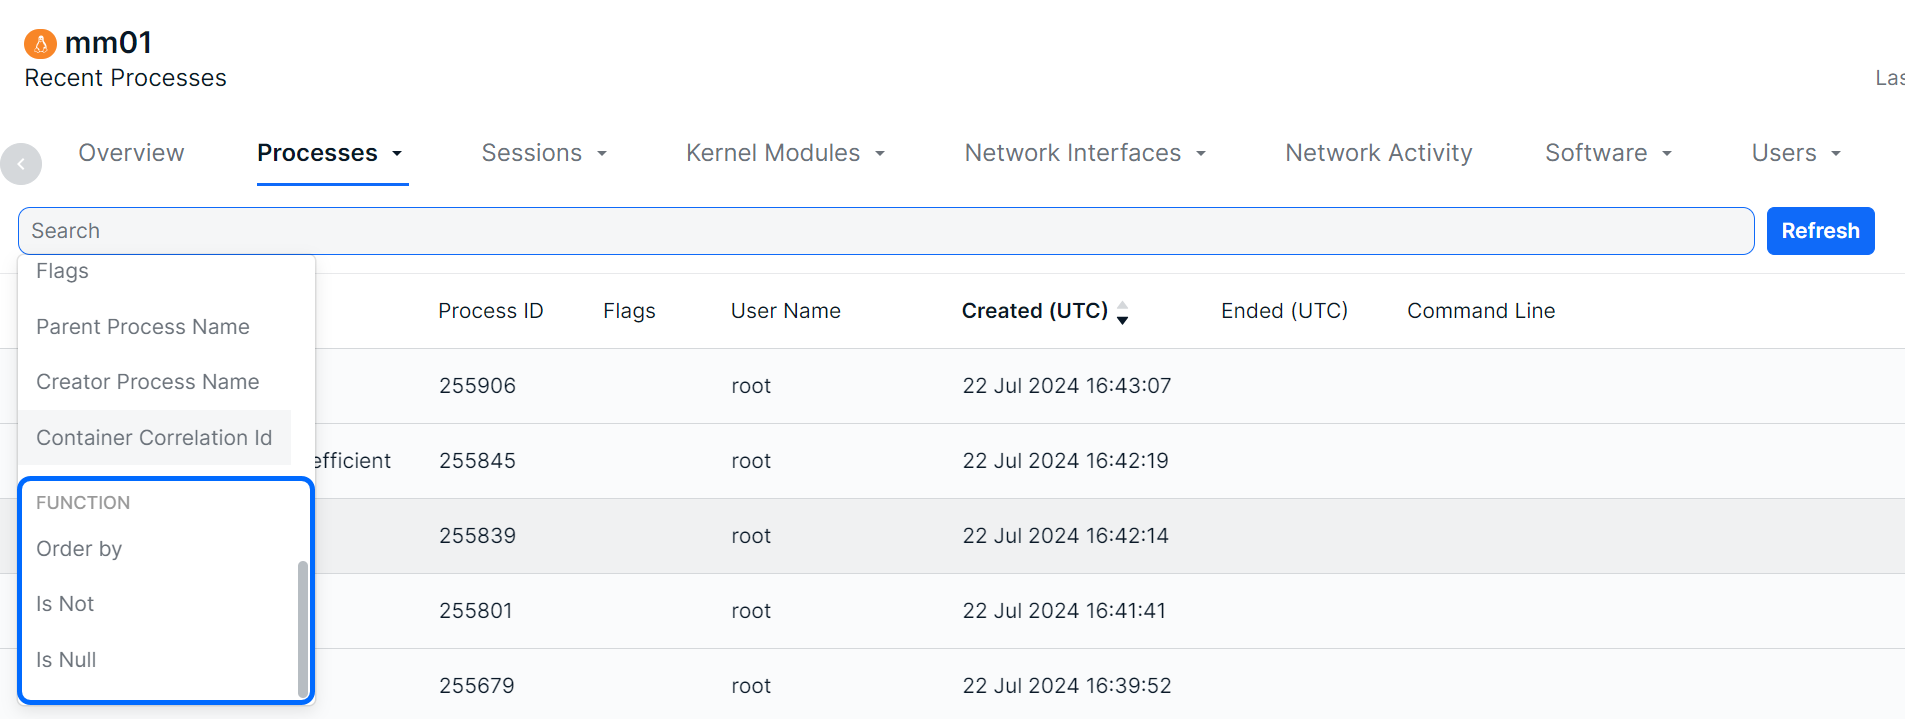
To sort the Agents list, click on a column header to toggle between a descending or ascending order for the selected column. You can also use the “Order By” feature shown as a suggested search function.
To filter the list, you can use the “Is Not” or “Is Null” suggestions. Using “Is not” will query results that do not include selected suggestions or provided keywords. The “Is Null” suggestion will query items with no content in the selected column.
As you make selections, you will be prompted with suggestions as shown above in Searching for Alerts.
If you want to filter this page by a specific time or date, the following date formats are supported:
- 2022-11-22T16:35:42
- 2022-11-22T16:35:42Z
- 2022-11-22T16:35:42.000
- 2022-11-22T16:35:42.000+0000
Exporting Results
You can export the entire list of alerts, or a filtered subsection, using the Export .csv icon.
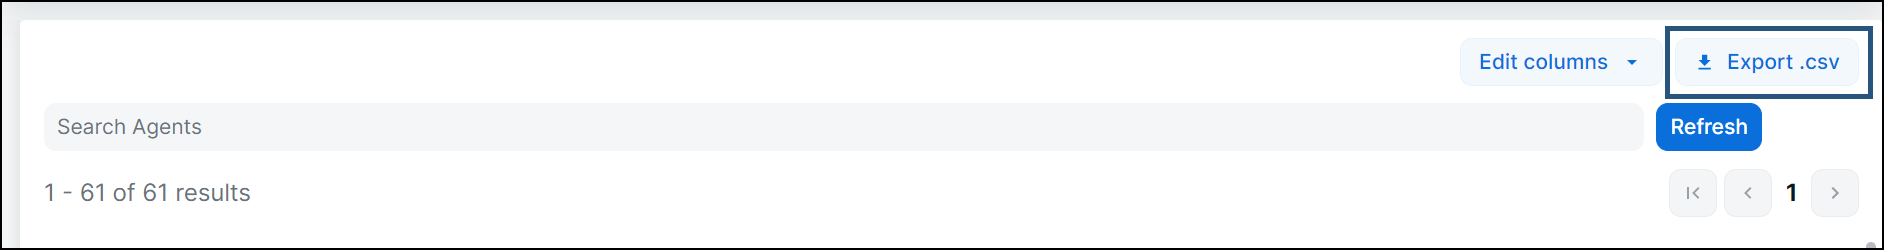
The export will be downloaded to your default folder.

Was this article helpful?
That’s Great!
Thank you for your feedback
Sorry! We couldn't be helpful
Thank you for your feedback
Feedback sent
We appreciate your effort and will try to fix the article