Introduction
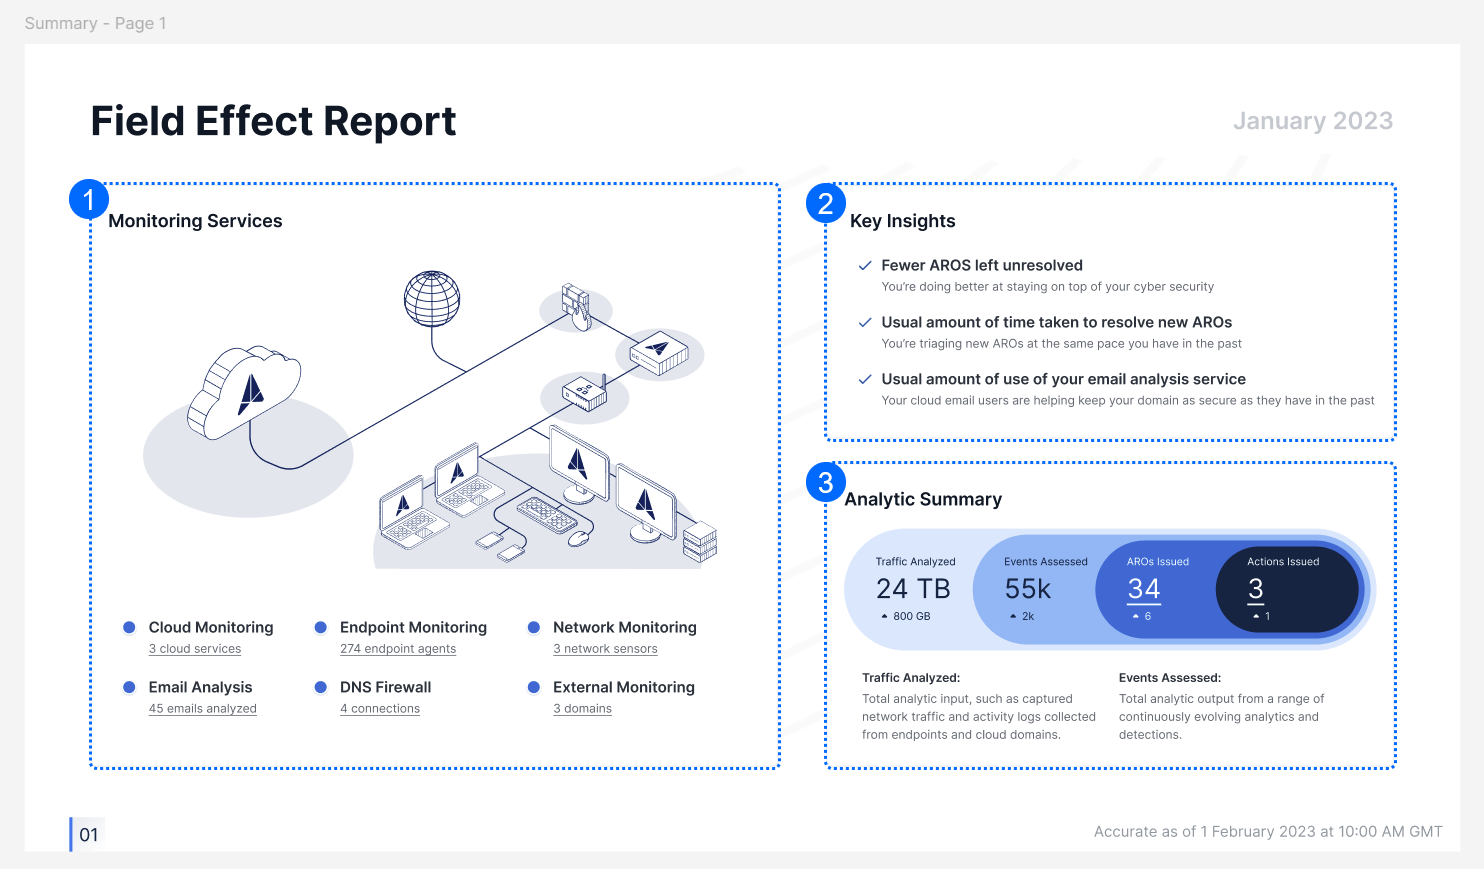
The Monthly Summary, available in the Field Effect MDR Portal's Reports view, provides a high-level view into the strength of your organization’s cyber security posture. All reports can be downloaded, and you can set notifications for this report, and others, from your Profile Settings.
The Monthly Summary is broken into the following sections:

Page 1: Field Effect Report
The first page of this report includes the following areas:
- Monitoring Services Summary
- Key Insights
- Analytic Summary
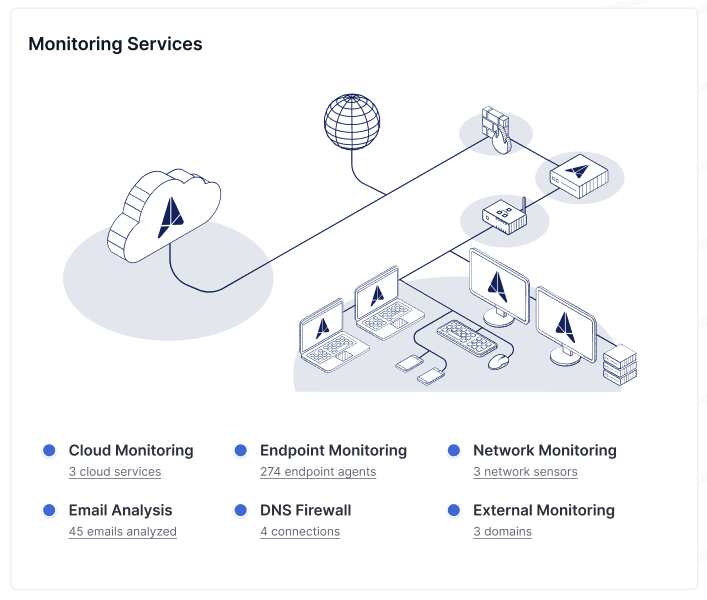
1 - Monitoring Services Summary
This area summarizes an organization’s deployment and the core services that are in place. The network illustration is color coded; blue items have 100% uptime for the month and orange items flag areas that experienced downtime over the month.
Below the illustration, metrics are listed for the for the following:
- Cloud Services: the number of cloud services an organization has enrolled for cloud monitoring.
- Endpoint Monitoring: the number of devices with an endpoint agent installed.
- Email Analysis: the number of emails submitted to SEAS by users in the organization.
- DNS Firewall: The number of active connections to the DNS firewall service
- A connection represents a group of devices at a single physical location (example: all the devices connected within an office).
- External Monitoring: the number of domains added to the organization’s Monitoring Profile.
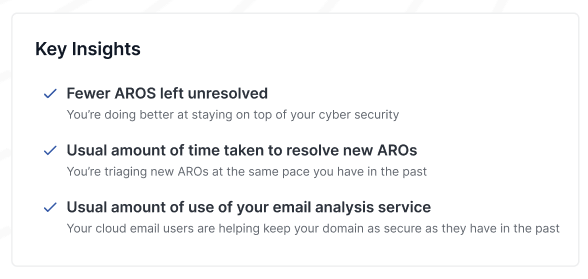
2 - Key Insights
This area flags the most important factors that are making an impact, positive or negative, on an organization's cyber security posture. In the example above, the organization has fewer unresolved AROs than the previous month, they took usual time that expected to address them, and the SEAS usage within the organization is considered “usual”, according on their previous history. Should any of these aspects start to "regress" (example: more AROs generated in a month), it will be reported here as an insight.
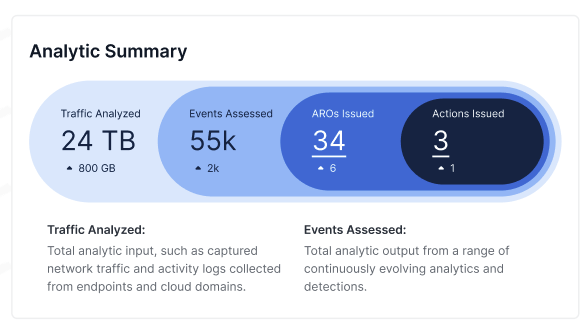
3 - Analytic Summary
This area is meant to help organizations visualize the amount of data Field Effect MDR analyzed and then distilled into actionable AROs. The visualization also includes the previous month's metrics for drawing quick comparisons. In the example below, Field Effect MDR analyzed 24 TB of traffic, and 55,000 events were identified and assessed for security reasons. Of the 55, 000 events, 34 AROs were issues, three of which were Action AROs.
Page 2: ARO Trends
This page looks are AROs at a higher-level, with insights, totals, and historical trend data.
This page includes the following sections:
- ARO Insights
- Response Summary
- New AROs Per Month
- Response Time Per Month

1 - ARO Insights
This section provides key insights about an organization's "performance" in terms of ARO management. The insights found here are usually related to the other three areas of this page; the number of AROs received and resolved, how quickly AROs resolves, etc. Should any of these aspects start to "regress", it will be reported here as an insight.

2 - Response Summary
This area reports on how many new AROs were issues in a given month, how many were closed, and how many remain unresolved. The New column includes a report of any "progress" (more or less AROs generated) since last month. In the example below, the organization had 3 Action AROs issued, which was 1 less ARO than the preceding month. 12 Observation AROs were also generated, which was 5 more than the preceding month. The organization also closed 7 of 8 Recommendation AROs, leaving 1 unresolved over the month.

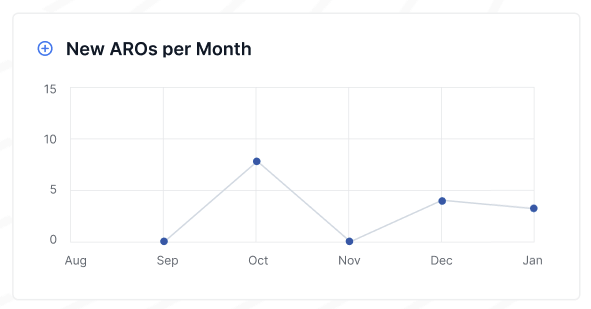
3 - New AROs per Month
This area shows a rolling 6-month timeframe of how many AROs, regardless of type, were generated within a given month.
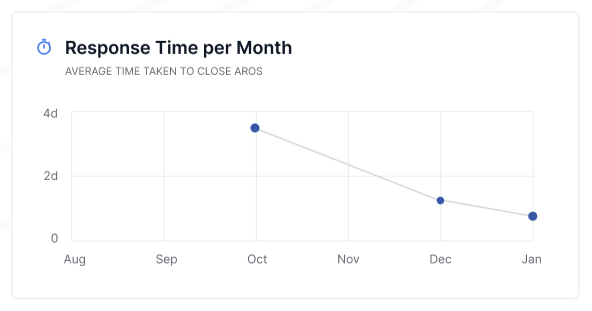
4 - Response Time per Month
This area tracks an organization's response time per month, also with a 6-month timeframe. An average of this timeframe is also provided under the title.
Was this article helpful?
That’s Great!
Thank you for your feedback
Sorry! We couldn't be helpful
Thank you for your feedback
Feedback sent
We appreciate your effort and will try to fix the article