Introduction
For Partners:
This page may behave differently depending how the Organization Selector is set. When set to the provider view, every client will be shown as a line item that can be expanded. When using a specific client view, only the selected client’s statuses will be shown as line items.
The MDR Portal's Status page reports the health of your core Field Effect services in a central area. From here, you can monitor the status of your organization’s Field Effect network sensors, endpoint monitoring, cloud monitoring, and the DNS Firewall.
It’s important to know that while these services are broken out into separate line items, the Network Monitoring and Endpoint Monitoring sections are both related to the field effect sensor.
This article covers the following topics:
Page Overview
If you're a direct Field Effect client, or a Field Effect partner using a specific client view, all your (or your end client's) statuses can be viewed from this page.
Healthy services are indicated using a green icon, and any issues with a service or feature will be marked with a yellow or red icon, depending on the scenario. Any service that hasn’t been setup yet will be marked with a grey icon.
This section walks through the different services outlined on the page when using a specific client view, and the different statuses for each service.
Refresh Intervals
The elements listed on the status page have the following refresh intervals:
| Item | Refresh Intervals |
|---|---|
MDR SIEM and Network Monitoring | Check in every 15 minutes. |
New Endpoint Agents | Check in as soon as they come online. |
Existing Endpoints | Every 10 minutes to update online/offline status. |
| Every 10 minutes to update feature statuses, endpoint risks, antivirus management status, and other properties. |

The Field Effect Appliance
The MDR SIEM represent the physical (or virtual) sensor that analyzes traffic on the network it's deployed in. If the main SIEM sensor experiences traffic issues, you will be notified in this area via a red status icon.
To learn more, visit our knowledge base chapters on virtual and physical network sensors.

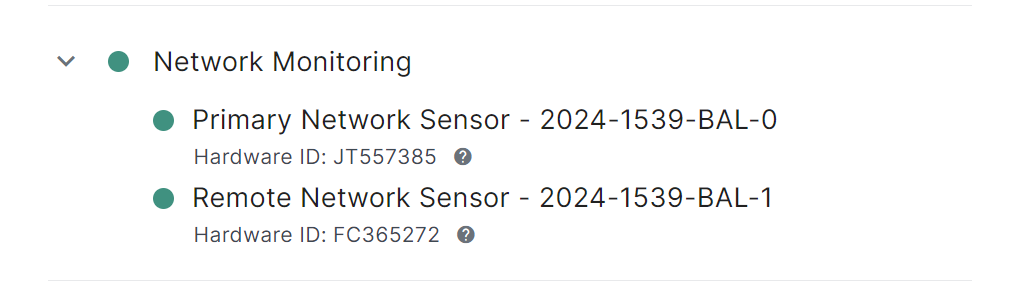
Network Monitoring
This section also relates to the network appliance, as network monitoring is powered by the appliance. The appliance's "core" represents the technology that analyzes traffic, and other data, to detect vulnerabilities or suspicious and malicious activity and report on it as required.
Every Field Effect MDR deployment typically includes one SIEM sensor (mentioned above) that performs the actual data analysis. Some deployments may span several physical locations or networks. In these cases, you may have one or more secondary sensors used to relay data from that location to the SIEM sensor. To learn more, visit our chapters on virtual and physical sensors.
This section also includes the hostname and Hardware ID for each sensor, which can be useful when troubleshooting a sensor with our Support team.
- Hostname: a unique identification number given to the appliance by Field Effect for tracking.
- Example: 123-456-FE-1
- Hardware ID: the serial number, last 6 characters of the MAC address, or other unique identifier provided by the manufacturer.
- Example: MF6F50B
Most network sensors will display a hardware ID that uses the serial number, whereas netflow sensors will display a Hardware ID that uses a fragment of their UUID.
If there are any issues with a sensor, it will be flagged in this list via a red icon.
Renaming Network Sensors
If you would like to rename a sensor for easy identification, click on the pencil beside the location.

The Edit Network Sensor Label window will appear on your screen. Give the sensor a label and click save

After labeling you sensor(s), the label will appear as a prefix to the codename.

Endpoint Monitoring
The Endpoint Monitoring section will always show a green status, along with the number of online agents, including the total number of agents. Offline agents may be the result of a device that is powered of.

If you haven't set up any endpoint agents in your environment, this section will be shown as grey until endpoint agents are installed and reporting traffic to a sensor. Otherwise, this service will be marked as online (green) with an offline and online endpoint count.

Cloud Monitoring
This section will list all of the cloud services you have enrolled for Field Effect Cloud monitoring. As you enroll services, they will be shown in the expandable list. Any services experiencing connectivity issues will be marked with a red icon, and remedying the issue is usually just a matter or reauthenticating the service.

DNS Firewall
When deploying up Field Effect MDR, your organization should have set up a monitoring profile, which helps us understand your organization and tailor our services to it. When setting up your monitoring profile, your organization should have created a "connection" for each physical network in the company and added that connection's public IPs.
Public IPs are required to enable our DNS Firewall, and you can learn more by visiting our knowledge base article on Setting up the DNS Firewall. The image below shows a user setting up their Public IP connection for their headquarters.

Once your organization's public IP connections are created and the DNS Firewall is enabled, each connection will be shown in the DNS Firewall section. If a single location does not report traffic after one hour, the specific location (along with the main DNS Firewall status icon) will be shown as yellow.
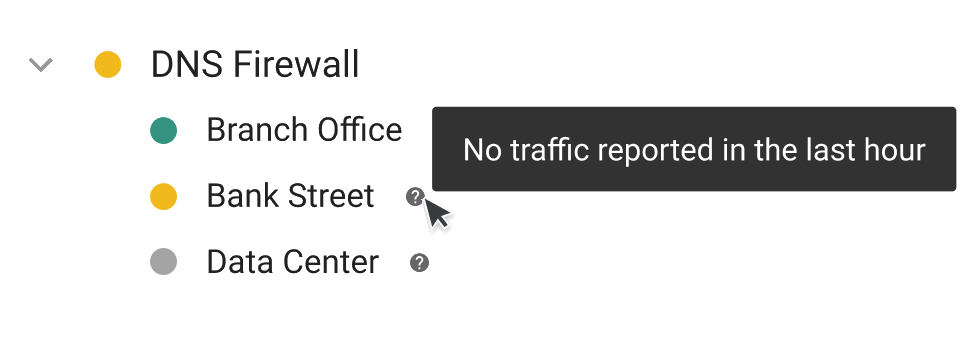
Another scenario that can cause the DNS Firewall to take on a yellow status is when the DNS API is offline. While the locations are protected, their exact status and configuration details are temporarily unavailable. Therefore, all DNS locations will have a yellow status when the API is offline.

If the DNS location has never reported traffic, it will take on a grey status. This is usually the result of the gateway device not being configured to point to our DNS server. See, DNS Firewall: Overview & Setup for more on configuring gateway devices.

Was this article helpful?
That’s Great!
Thank you for your feedback
Sorry! We couldn't be helpful
Thank you for your feedback
Feedback sent
We appreciate your effort and will try to fix the article