Introduction
As AI usage becomes more common and widespread, organizations currently have no visibility into what AI tools are installed on endpoint devices, or what AI SaaS applications are being used by employees. AI adoption is outpacing AI governance, and this is leaving organizations exposed to uncontrolled AI usage, IP exposure, and data leakage. Without a clear answer to "what AI is being used in my company, and where?", organizations cannot begin to apply risk management or controls.
Our new AI Monitoring page, found in the Appliance Dashboard's (MDR SIEM) Endpoints section, begins to answer this question. Currently, this page is focused on providing AI usage visibility by surfacing AI tool presence and usage patterns. Within this visibility, organizations can make informed decisions about AI risk in their environment.
We plan on iterating on this page over time, but this article explains its current functionality across the following topics:
Page Overview
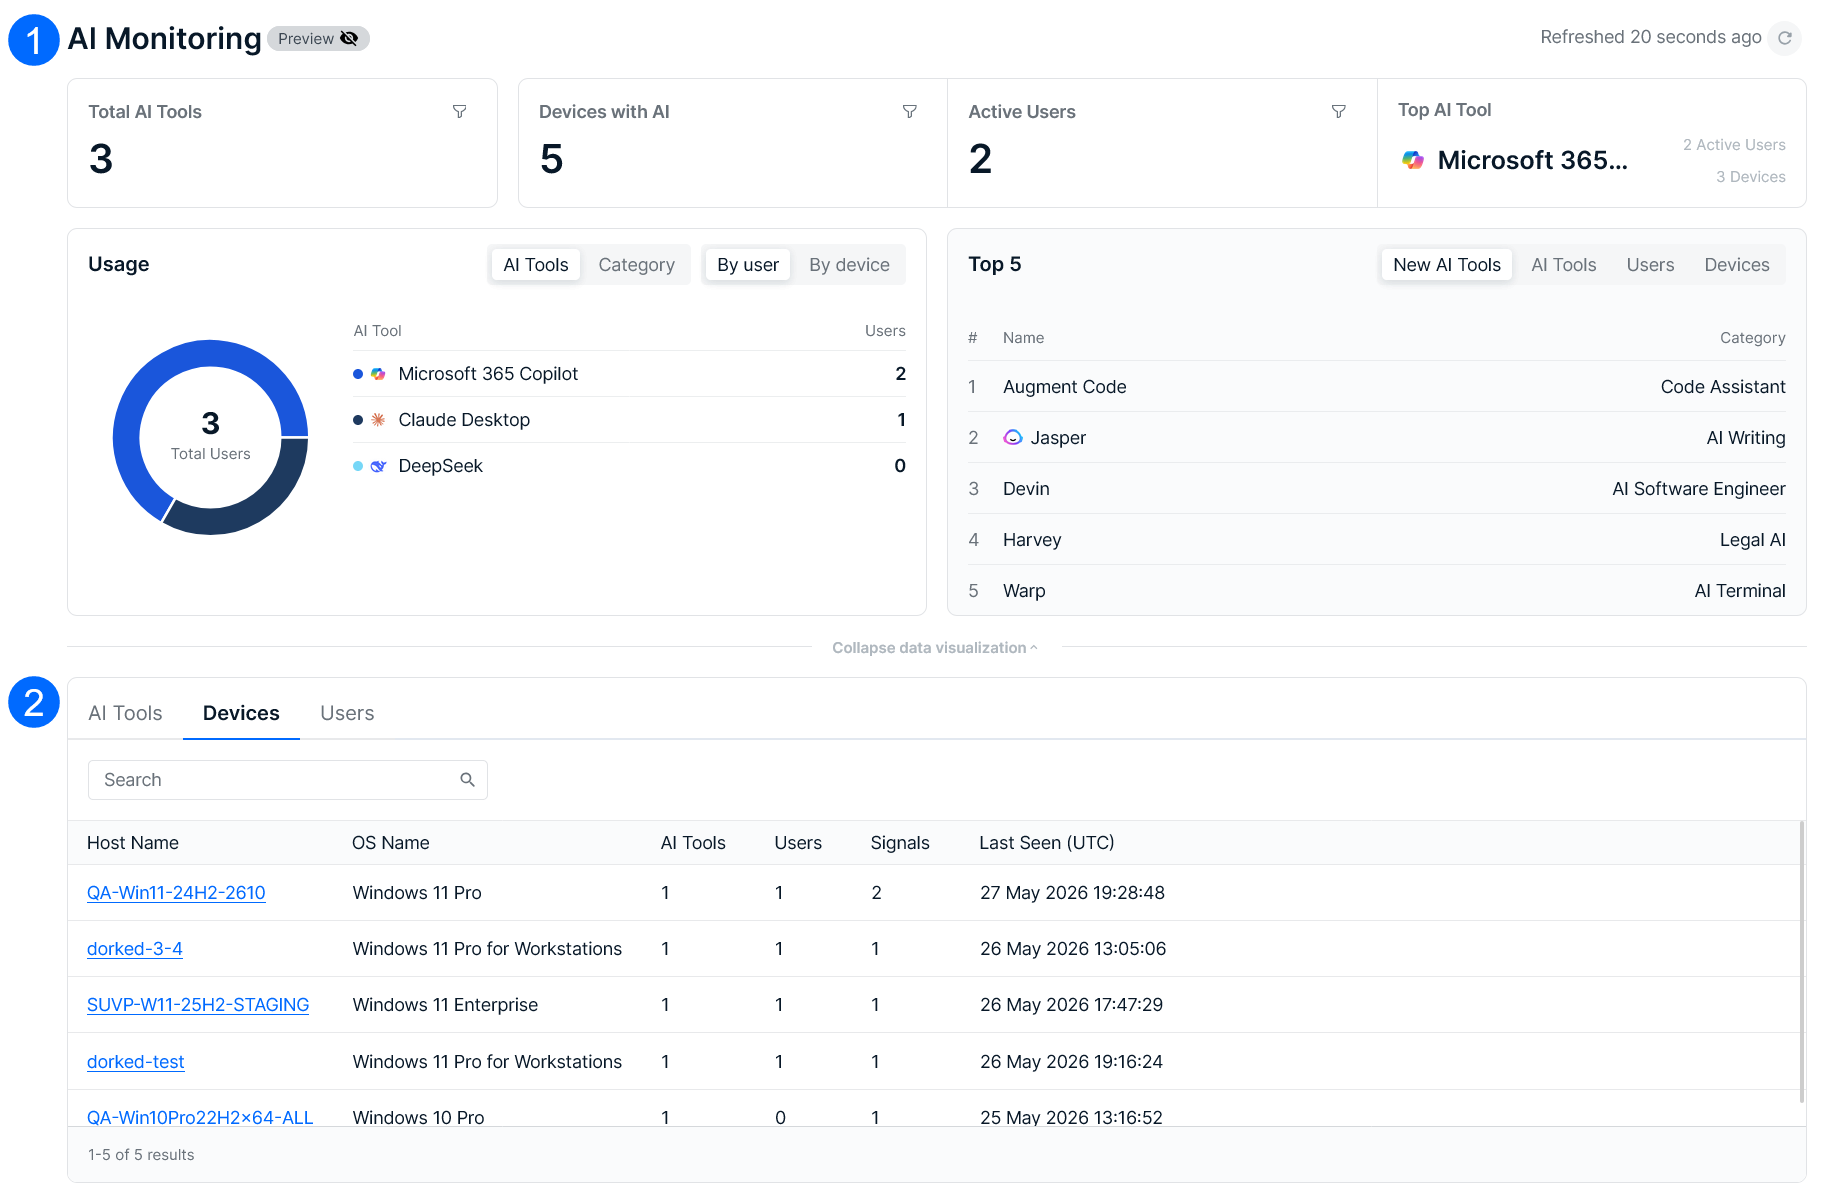
This page is made up of (1) a Summary Dashboard that gives high level visibility into AI usage and (2) a Usage Table that allows you to drill into more granular details. You can also filter by Time Frame to the upper right of the page. Click the icon to select the time frame this page should report on.
Summary Dashboard
The Summary Dashboard is meant to give at-a-glance statistics about your organization's AI usage. The top-level metrics report on a 4-week window that includes the following:
Total AI Tools: the total number of AI tools that Field Effect MDR observed in your environment.
Devices with AI: the total number of devices Effect MDR observed using an AI tool in your environment.
Active Users: the total number of users Field Effect MDR observed actively using AI tools in your environment.
Top AI Tool: The AI tool being used most among your organization's users.
Click on the filter to filter the Usage Table to show result for only that metric.

The visualization below can be set to display the AI Tools or Tool Category and group the results by user or device. The Top 5 section lists the top AI tools (new or all) found in your environment, the top 5 users, or top 5 devices using AI in your environment. Click See all users to navigate to the Devices Page.
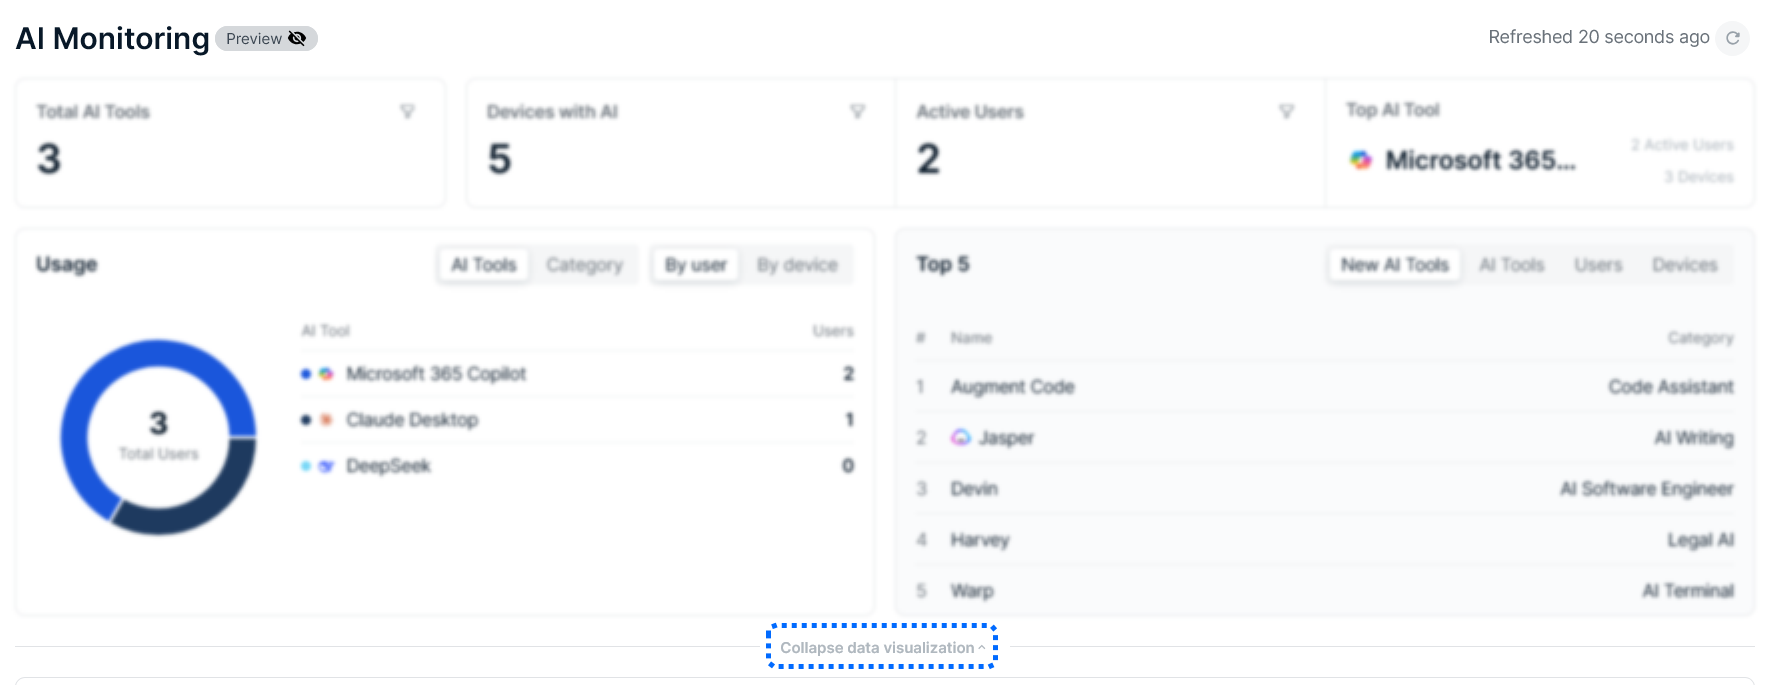
Click the Collapse Data Visualization divider if you would like to hide this section to focus on the usage table.
Usage Table
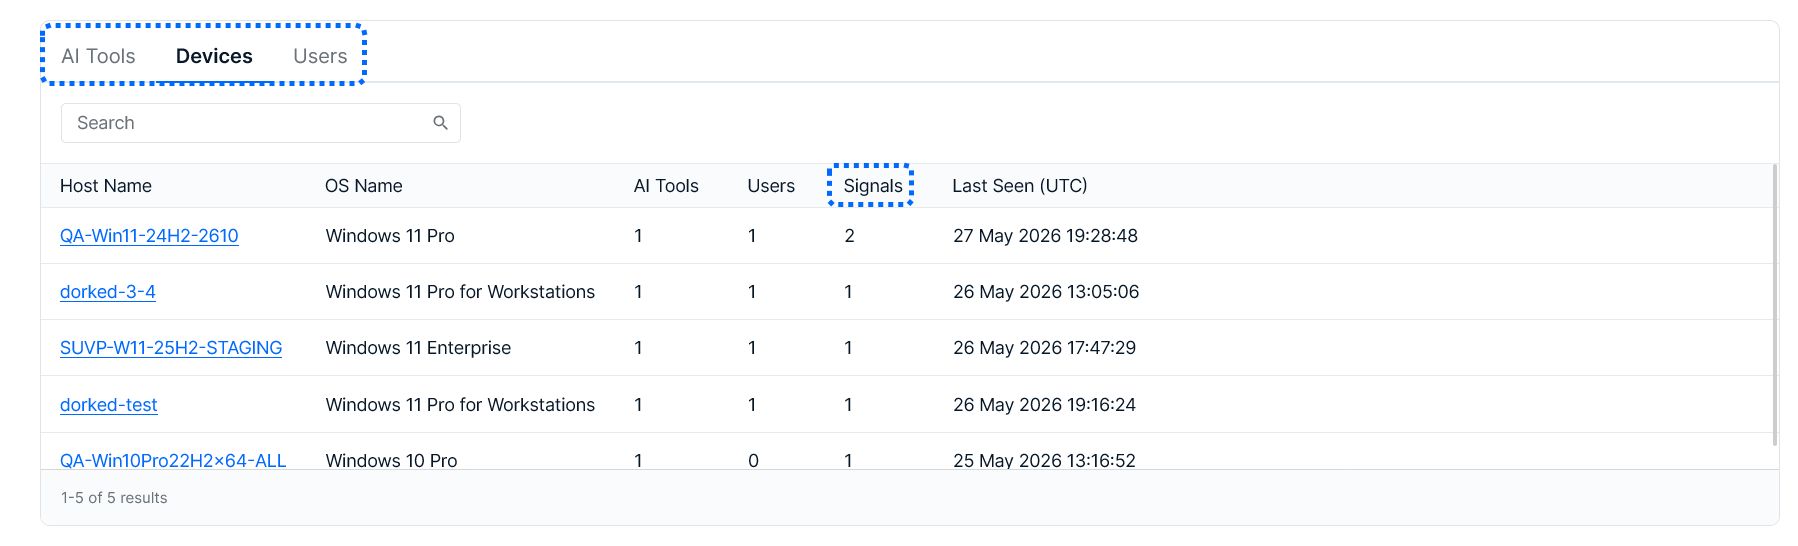
The Usage Table is made up of 3 tabs: AI Tools, Devices, and Users. Each tab has their own columns, and you can click on a column header to assign and toggle the table's sort order.
Each tab contains the following columns:
AI Tools: AI Tool, Vendor. Category, Users, Devices, Recent Use, and Last Observed Use.
Devices: Hostname, OS, Number of AI Tools, Recent Use (whether recent AI tool use was observed on the device), and Last Observed AI Use timestamp.
Users: Username, Number of AI Tools, Recent Use (whether recent AI tool use was observed for the user), and Last Observed AI Use timestamp.
Use the search bar on any tab to narrow the results further.
Drilling into the Usage Table
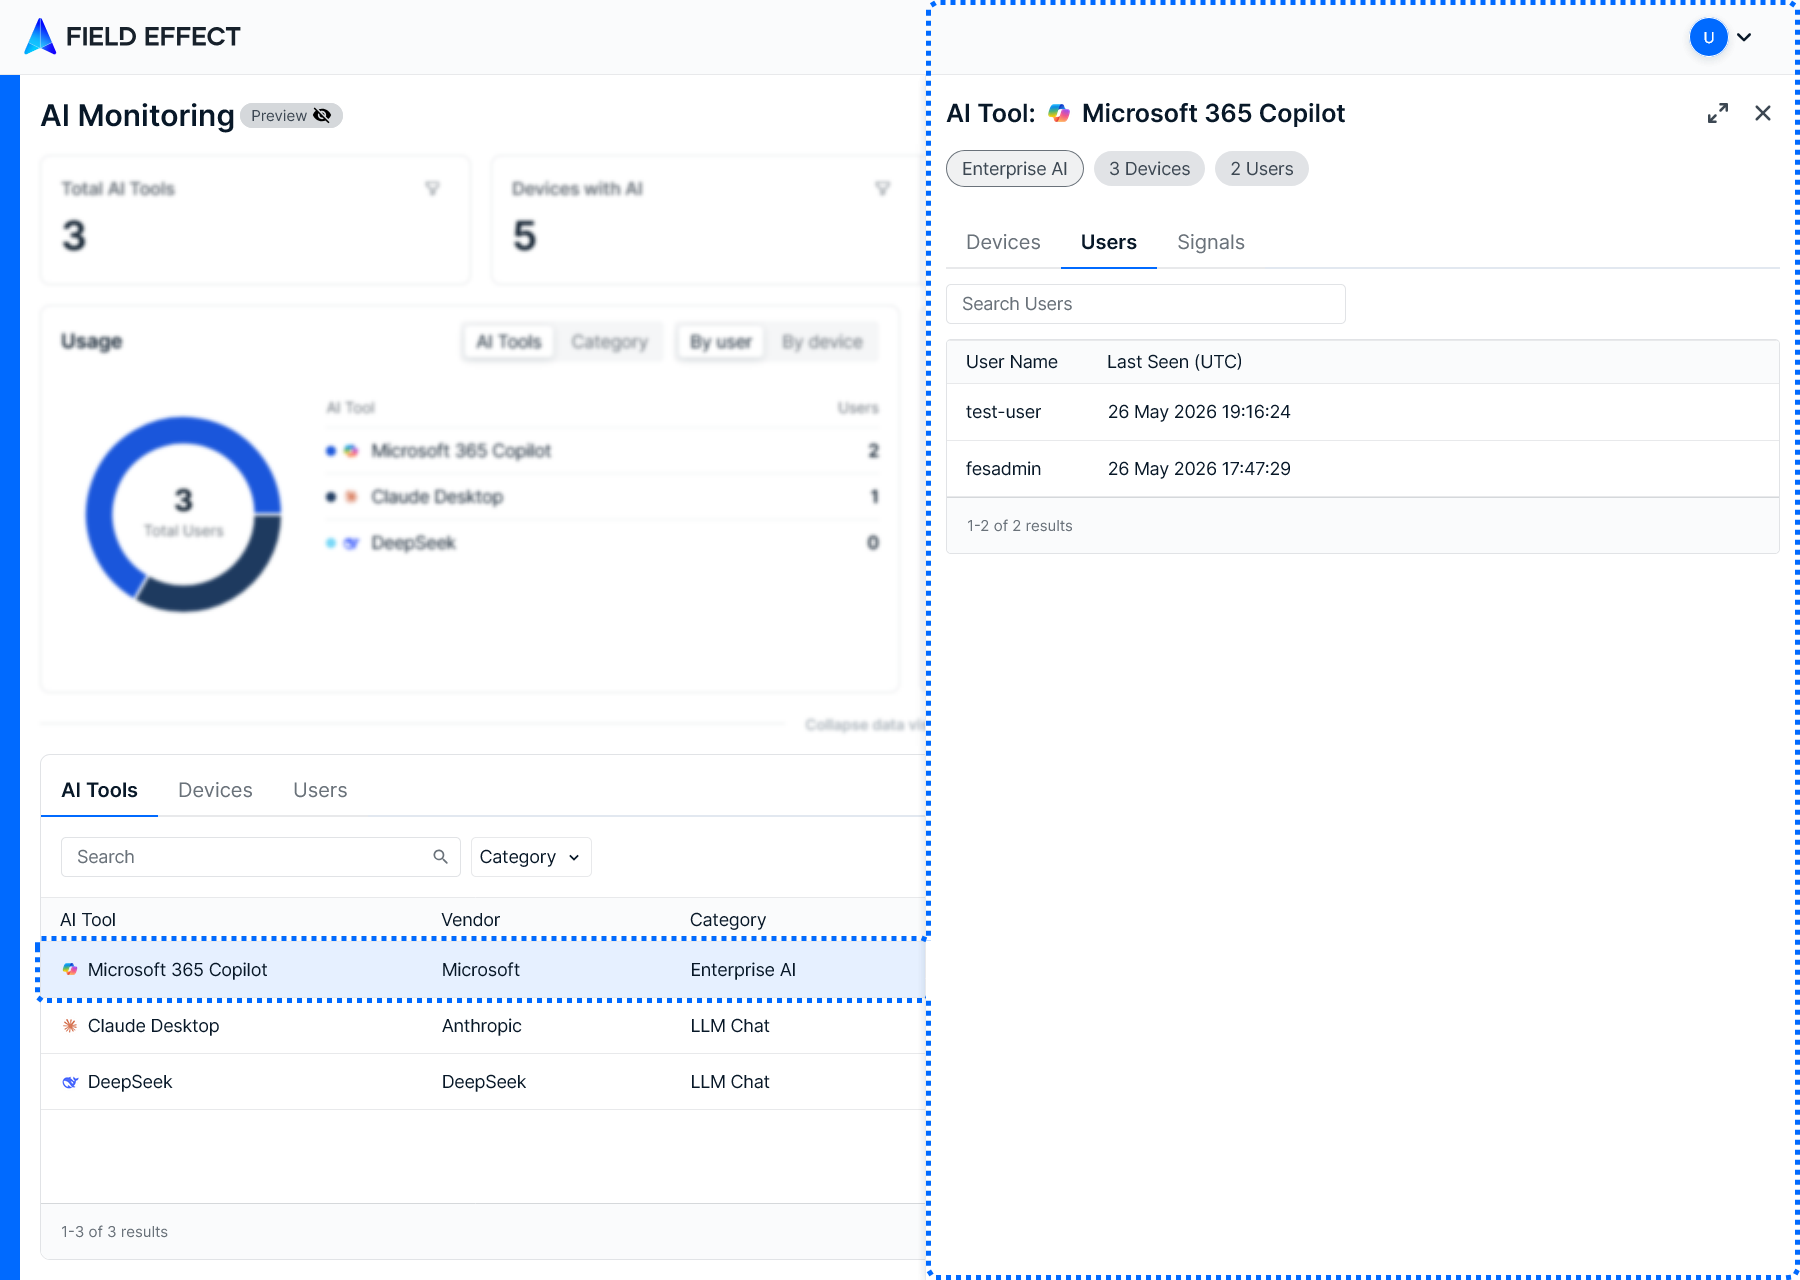
You can click on an entry from either tab to open a details pane that shows more information about the AI tool, device, or user. These panes offer more table and tab views, and the following sections show examples of each details pane, and the various extra tabs.
- AI Tools: extra details about which devices the tool is present on (Devices tab), who is using the AI tool (the Users sub-tab), and the signals/events used to detect it (Signals tab). Each tab has a search bar to perform searches against the main column. The Signals column also offers filtering for Domains, Processes and Software.
- Devices: extra details about the AI tools seen on the device, the users seen using AI on the device, and the events/signals used to detect AI use on that device.
- Users: extra details about the AI tools observed being used by the user, the devices seen running AI for the user, and the events/signals used to detect AI use by that user. Each tab has a search bar to perform searches against the main column.
The example below shows the details pane open for an AI tool entry:
Was this article helpful?
That’s Great!
Thank you for your feedback
Sorry! We couldn't be helpful
Thank you for your feedback
Feedback sent
We appreciate your effort and will try to fix the article